How much profit are you actually making per plate?
Calculate what a dish actually costs to produce. Instantly see the total recipe cost and gross profit margin. No signup.
The free food cost calculator converts a recipe's ingredients, quantities, prices, and yield percentages into a plate cost, a food cost percentage, and a suggested menu price to meet your target margin.
It works simultaneously as a plate cost calculator and a food cost percentage calculator — enter ingredients once and get both outputs.
Recipe costings are the baseline for food cost control, alongside regular stock counts.
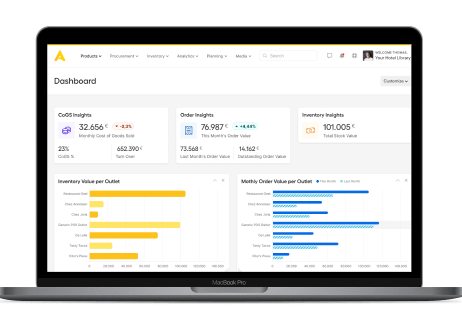
Apicbase uses live supplier prices to calculate recipe costs and margins. It connects inventory with POS data, so you can see the difference between expected and actual food cost. Head office manages pricing and margins for every site from one place.
Development chefs, executive chefs and F&B controllers use it for a quick margin check before a dish goes on the menu, or to decide whether to absorb, reprice, or reformulate when supplier prices change. The tool handles subrecipes too, so you can cost components separately.
Enter your ingredients, quantities used, and unit prices and instantly see your recipe cost and dish margin.
Follow these six steps.
Type the menu item name in the Recipe Name field.
How many plates does this recipe make? The calculator divides total recipe cost by this number to give you the cost per portion.
Pick from the dropdown (USD, EUR, GBP). The cost column and the suggested menu price will match your choice.
For each line, enter ingredient name, quantity in the dish, unit, unit cost, and yield %. Yield benchmarks are in the table below.
The unit dropdown supports metric and imperial — kg, g, L, ml, each, oz, lb — so you can match how your supplier quotes you (per kg, per lb, per case of 12 each). Click ‘+’ to add an ingredient or ‘×’ to remove a line.
The Result block shows the total recipe cost and the cost per portion as soon as you've entered the ingredients.
Move the Target food cost % slider to set the margin for this dish. The Suggested menu price (ex VAT) updates in real time. If you prefer to think in Gross Profit (GP), the slider works the same — a 28% food cost is a 72% GP.
Already have a price on the menu? Type it into the ‘Or enter your current menu price’ field, and the tool shows your actual food cost % against that price.
Use Reset to start over, Print for a kitchen-friendly copy, or Export CSV to drop the recipe into a spreadsheet. Save the files or share them with the finance team, F&B management or operations managers.
These three formulas drive the calculator.
Ingredient cost in dish = (Quantity used × Unit price) ÷ Yield %
Plate cost = Σ ingredient costs ÷ Portions
Example: 200 g of trimmed beef tenderloin per plate, bought at €42/kg, with a 75% yield (trim and shrinkage): (0.200 × 42) ÷ 0.75 = €11.20 of tenderloin per plate.
Food cost % = (Plate cost ÷ Menu price) × 100
Example: Plate cost €6.06, menu price €24: 6.06 ÷ 24 × 100 = 25.3%.
Restaurant operators often use "food cost %" to mean two different things: the cost of an individual dish, and the cost of food used over a month, based on inventory. Here, food cost % refers only to the cost of an individual dish.
Menu price = Plate cost ÷ Target food cost %
Example: Plate cost €6.06, target 28%: 6.06 ÷ 0.28 = €21.64.
This is also what makes the tool a menu price calculator: enter your target food cost %, and get the price that hits your margin.
If you trained in a UK or Irish kitchen, you might track GP (gross profit) rather than food cost percentage. They're the same from opposite ends:
GP % = 100% − Food cost %
Set the target food cost % slider to 25% to target a 75% GP on that dish.
Yield % is how much of what you bought ends up on the plate — after trim, fat, bones, peel, evaporation, and cooking loss.
Without it, the calculator assumes you use everything you buy, and your costs will look lower than they are.
For example, you buy 200g of tenderloin at €42/kg. At 100% yield, the cost is €8.40. At 75% yield, you need to buy 267g to get 200g on the plate — the real cost is €11.20. That's €2.80 more per plate. Across 80 plates a week, that's €224 gone missing every week.
| Ingredient | Typical yield |
|---|---|
|
Beef tenderloin
|
70–75% |
|
Whole chicken |
55–65% |
|
Salmon fillet |
80–90% |
|
Whole leafy greens |
70–80% |
|
Whole onions |
85–90% |
|
Whole tomatoes |
80–90% |
|
Dry pasta, rice, dry beans
|
100% |
|
Pre-portioned proteins (case-ready) |
95–100%
|
Typical yields adapted from US Foods 'Common Product Yields and Conversions' and 'Produce Yields', Chefs‑Resources Produce Yield Chart, and FAO 'Tables on Weight Yield of Food and Retention Factors of Food'
There's no single right answer. Food cost % depends on your concept, service model, menu mix, and local market. Use the industry ranges below to sanity-check your number.
| Concept | Typical food cost % |
|---|---|
|
QSR (burgers, fried chicken, tacos) |
20–25% |
|
Fast casual
|
26–32%
|
|
Casual dining |
28–34%
|
|
Fine dining |
30–40% |
|
Pizza
|
28–32%
|
|
Café / bakery‑café |
30–35% |
|
Bar‑forward (gastropub, tapas)
|
30–35% |
Choose a food cost percentage that fits your profit goal. Food cost is one of the two main variable expenses; labour is the other. Together, they make up your prime cost. Most independent restaurants try to keep prime cost at 60–65% of sales or less. For example, 32% food cost and 28% labour cost give you a 60% prime cost.
Delivery changes the math. Platforms like Deliveroo, Uber Eats, and Just Eat typically charge 15–30% in commissions, on top of packaging and other costs. If a large share of your sales comes through delivery apps, your real cost per order is higher than the calculator shows. Price and analyse dine-in and delivery orders separately.
Premium ingredients can support a higher food cost percentage. A 38% food cost on a €52 entrée often generates more profit per plate than a 24% food cost on a €9 burger. Focus on margin, not just percentages. Menu engineering is about maximising contribution margin, not achieving the lowest food cost %.

A food cost calculator is a useful first step. But across multiple sites, costs change faster than an online tool can keep up.
Supplier prices change. Portions drift. Recipes get changed locally. Before long, your margins are based on outdated numbers.
Apicbase keeps recipes, ingredients, purchasing, and inventory connected. When a price, supplier, or portion changes, every related recipe updates automatically.
Per-plate food cost is (Plate cost ÷ Menu price) × 100. Plate cost itself is the sum of (Quantity used × Unit price) ÷ Yield % across every ingredient in the recipe, divided by the number of portions. Use net-of-VAT prices on both sides so the percentage stays clean. For the company-wide food cost % you see on the P&L — the inventory-math version — see our guide on how to calculate food cost percentage.
Most restaurants run a food cost between 25% and 35%. QSR and pizza tend to sit lower (22–25%), fine dining higher (30–40%). The “right” number depends on your concept and on what your labour cost is doing — together they form your prime cost, which most independent restaurants try to keep at or below 60–65% of sales.
Add up the cost of every ingredient in the recipe — quantity used × unit price, divided by yield % — then divide the total by the number of portions the recipe produces. The calculator above does this for you. Worked example: a recipe with €24.24 in ingredients that makes 4 portions costs €6.06 per plate.
After. If you calculate food cost using the price you paid per kilogram or per case, and you ignore the trim, bones, peel, or cooking loss, you’ll understate the cost of every plate by 5–30%. Apply yield % to every ingredient that loses mass between purchasing and plating.
Recipe cost is the total cost to produce one batch of a recipe — all ingredients added up. Food cost % is what that recipe costs as a share of the menu price. A recipe might cost €24 to make in total; if it serves four and sells for €24 a plate, your food cost % is 25%. See our guide on recipe costing for the discipline that keeps every plate cost accurate as supplier prices and ingredients change.
Yes — and a lot of operators start there. An Excel template works for one or two dozen recipes if you keep it disciplined: one row per ingredient, columns for unit price, quantity, yield %, and a calculated cost field. It stops scaling once you need per-location pricing, supplier substitution, allergen tagging, or a connection to invoices. The calculator above is a faster version of that Excel for single recipes; food costing software takes over when you outgrow a spreadsheet.
Every time a supplier price changes by more than a few per cent, every time you change a recipe, and at minimum, quarterly across your whole menu. Operators with a recipe management system get this for free — invoice prices feed the recipe costs automatically. Operators on Excel re-cost once a quarter and find out at month-end that they’ve been losing margin for ten weeks. That gap between what your recipes say you should be spending and what you actually spend is food cost variance — the number you watch every month if you want to keep food cost under control.
Food cost is one of the two big variable costs in a restaurant P&L. Prime cost is food cost plus labour cost. Most independent restaurants target a prime cost of 60–65% of sales. If your food cost is 30% and your labour is 32%, you’re at 62% prime — healthy. If food is 30% and labour is 40%, you’re at 70% prime — bleeding. For how prime cost fits into the wider P&L, see our read on restaurant profit margin.
They’re complementary — same recipe, opposite framing. Food cost % = (Plate cost ÷ Menu price) × 100. GP % = 100% − food cost %. A dish with a 28% food cost runs a 72% GP. UK and Irish kitchens usually quote GP; US and most EU operators quote food cost. The calculator above outputs food cost %, but you can read every number on it as a GP target by subtracting from 100.
Subtract the plate cost from the menu price, then divide by the menu price and multiply by 100. Worked example: a dish with a €6.06 plate cost selling at €24 generates (24 − 6.06) ÷ 24 × 100 = 74.7% GP. The calculator above gives you the same answer in food cost % terms (25.3%) — they sum to 100.