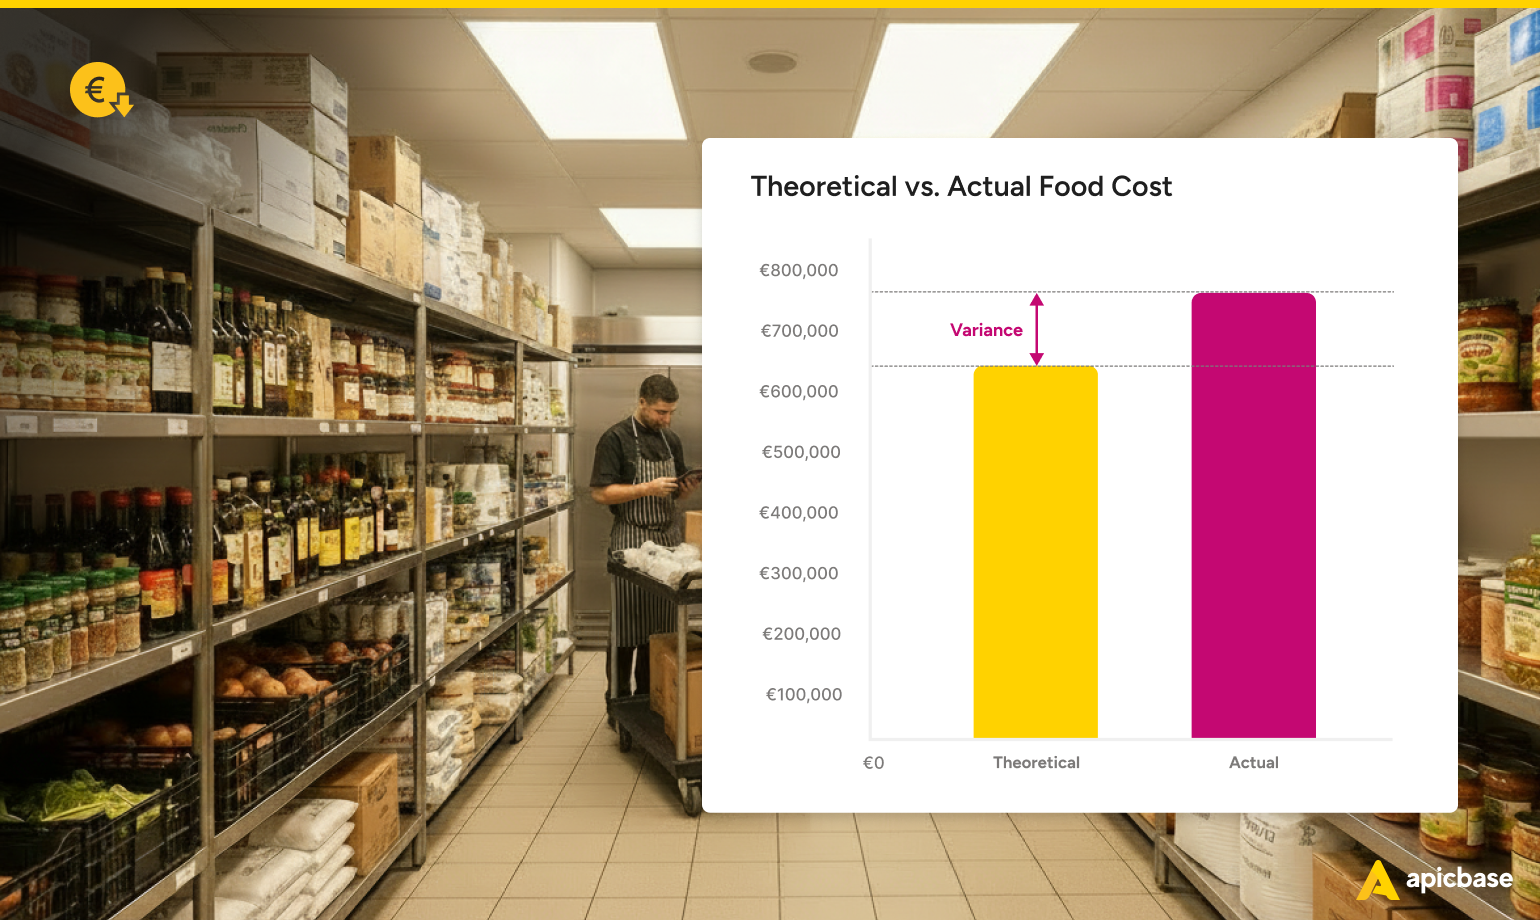
Food cost variance is the difference between what a restaurant should have spent on food and what it has actually spent in a given period. Theoretical food cost comes from recipes and sales data. Actual food cost comes from inventory. The gap between the two tells you whether COGS are under control.
Most foodservice operators track food cost at the P&L level — total spend against total revenue. That shows your margins, but it won’t tell you where the money is going. Over-portioning? Waste? Theft? Receiving errors? You can’t see any of it from the P&L. Food cost variance brings it to the surface.
A well-run multi-site operation targets a variance of 2–3%. Many run much higher without realising it — usually because the data is fragmented. Recipes live in Excel, procurement in the accounting system, sales in the POS, and stock counts on a clipboard. Without connecting those systems, you can’t move beyond the P&L number.
This guide covers how to centralise the data, measure food cost variance, diagnose what’s driving it, and close the gap.
Less variance, more margin
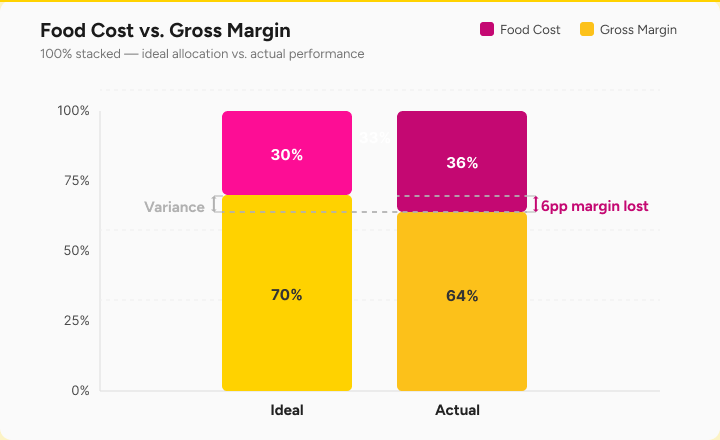
Monitoring food cost variance matters, because food cost is the single largest controllable expense in foodservice — usually 25–35% of revenue. Even small variances compound fast. A 2% variance on a site spending €50k/month on food means €1k lost every month. Across 20 sites, that’s €240k/year in preventable loss.
As Carl Jacobs puts it: “A restaurant chain that cuts food cost variance by a few percentage points could save millions a year.”
It’s a problem the whole industry feels. According to the National Restaurant Association, more than nine in ten operators say food costs remain a significant challenge, with average costs now more than 35% above pre-pandemic levels.
Peter Schimpl, VP of Digital and IT at L’Osteria (170 restaurants), puts it simply: “We think we know our numbers because we do a monthly inventory. But that’s mostly for finance. The real task, in my opinion, is turning raw inventory data into useful information. Good data gives you confidence in food costs, menu changes, pricing, and new concepts. Without a solid data foundation, you risk making bad decisions across the company.”
What’s the difference between theoretical food cost and actual food cost?
Theoretical food cost is what your food should cost if everything goes perfectly — zero waste, perfect portioning, no theft, no spoilage, and every ingredient received at the expected price. A free food cost calculator can give direction. Theoretical is also known as the ideal food cost. It’s calculated from your recipe cards and sales mix:
The formula is:
Theoretical Food Cost = Recipe Cost per Dish × Portions Sold

You take the exact ingredients, quantities, and current purchase prices to get the recipe cost per dish, then multiply by the number of portions the POS reports as sold. For the full calculation, including how to express it as a percentage of revenue, see our guide on how to calculate food cost.
Actual food cost is what you really spent. It’s calculated from inventory:
The formula is:
Actual Food Cost = Opening Inventory + Purchases − Closing Inventory

This captures everything theoretical cost ignores: waste, over-portioning, spoilage, and receiving errors.
Where the money leaks
The difference between the two — the variance — tells you how much money you’re losing. As Andreas Wehler, formerly at Fabrique, put it: “We know the total margin, but we don’t know what part of that margin is cost of goods, how much is waste, and how much is administrative waste. You really want to split that up into the different reasons.”
The usual suspects are over-portioning, unrecorded waste, supplier price discrepancies, inaccurate yield percentages, and untracked consumption, like staff meals. We’ll dig into each one later.
You need both numbers
Theoretical cost without actual is just an assumption. You know what things should cost, but not whether reality matches. Actual cost without theoretical is just a number. There’s no benchmark to tell you if the site is doing well or badly.
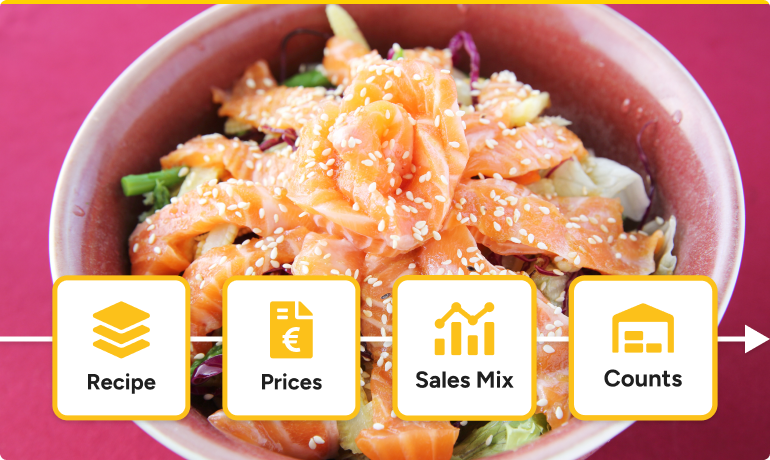
Tracking food cost variance means connecting both sides. It creates a closed loop in which theoretical cost flows from recipes multiplied by sales, and actual cost flows from purchases minus closing stock. The variance between them reveals where money is leaking.
In Apicbase, theoretical and actual costs are calculated from the same underlying ingredient and recipe data, so the comparison is reliable — no need to reconcile disconnected spreadsheets.
How do you calculate food cost variance?
The food cost variance formula is straightforward: subtract theoretical food cost from actual food cost.
The full formula is:
Food cost variance = Actual Food Cost − Theoretical Food Cost

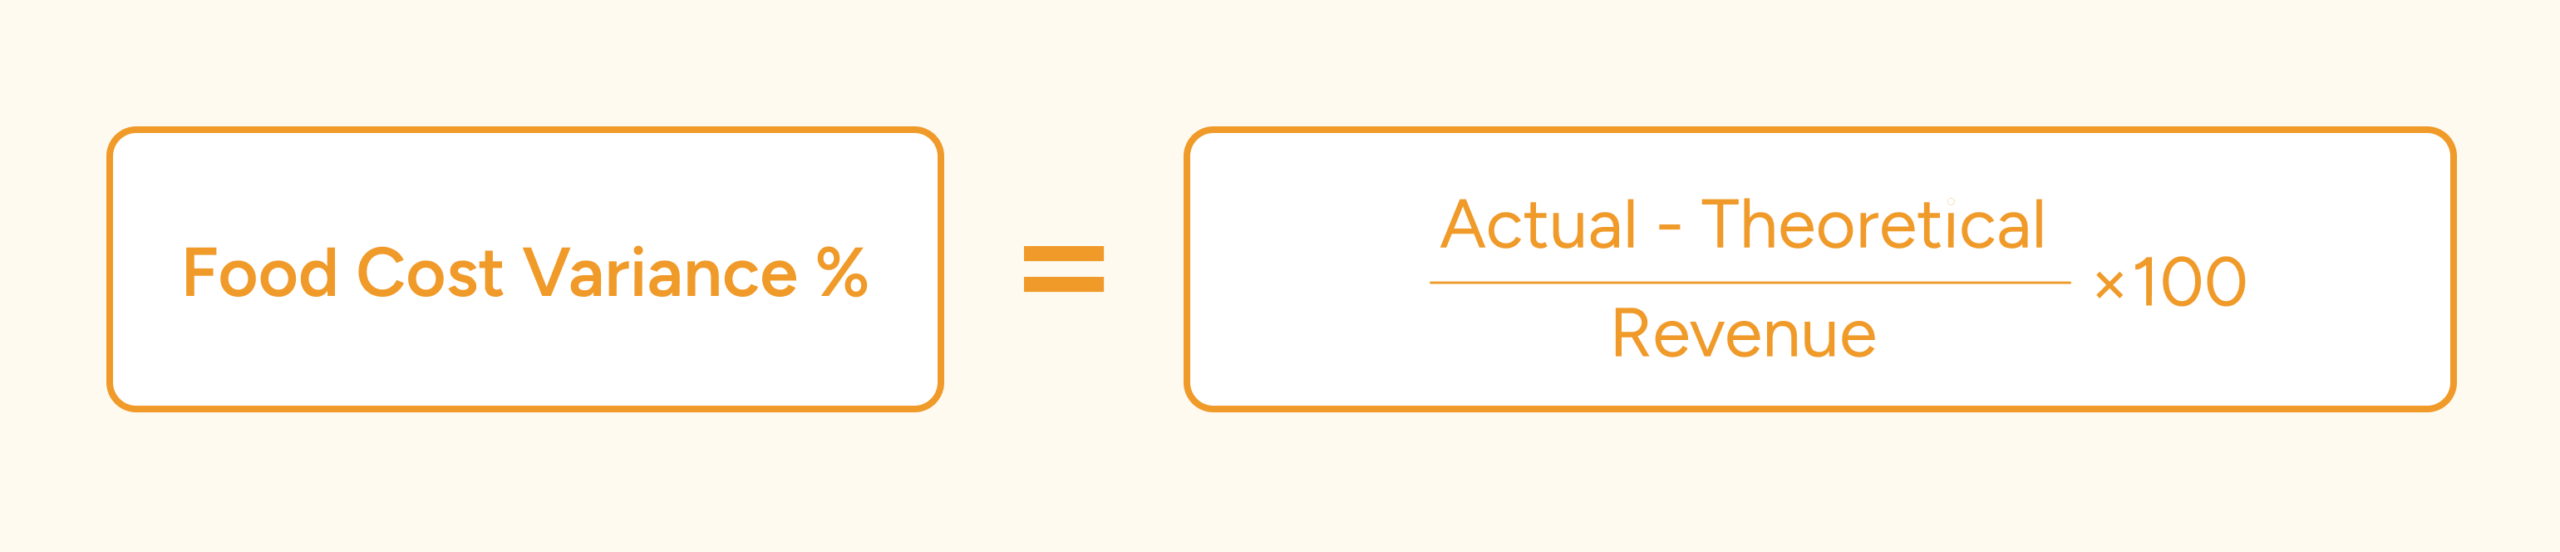
As a percentage of revenue:
Variance % = (Actual Food Cost − Theoretical Food Cost) / Revenue × 100
A positive variance means you’re spending more than you should.
Example: A site does €60,000 in revenue for the month. Theoretical food cost is €18,000. Actual food cost comes in at €21,000.
- Absolute variance: €3,000 = €21,000 − €18,000
- Variance %: 5% = (€3,000/€60,000) × 100
Getting the data right is harder than the maths
The formula is simple. It’s the inputs that break down in practice.
Theoretical cost needs up-to-date recipe cards with accurate quantities and yield factors, current purchase prices for every ingredient, and a sales mix from the POS that reflects what was actually produced.
If any of those are outdated, your baseline is wrong before you start. As the head chef of a global luxury hotel group put it: “There are periods of months when we’re working on an old costing for a dish; it’s just haemorrhaging money.”
Actual cost needs accurate inventory counts, deliveries checked against invoices, transfers between locations tracked, and waste recorded. Skip any of those, and your actual number is just as unreliable.
As the operations lead at a multi-brand cloud kitchen told us: “We consistently see around €10k in differences between what should be there and what actually is.” Much of that turned out to be noise from bad data.
Once you can trust both numbers, the real food cost variance analysis begins: breaking the numbers down by category, item, location, and cause.
What causes food cost variance?
The causes fall into three categories: operational problems, procurement issues, and bad data that looks like real variance.
| Cause | Category | Example |
|---|---|---|
| Portioning and production drift | Operational | Cooks eyeballing 200g portions that should be 180g |
| Waste and spoilage | Operational | Expired product, prep trimmings, burned or dropped items |
| Theft and unrecorded consumption | Operational | Untracked staff meals, tastings, and shrinkage |
| Procurement and receiving errors | Procurement | Short deliveries accepted, price increases not updated |
| Inventory counting errors | Data | Miscounted units, inconsistent methods across staff |
| Recipe and system data problems | Data | Outdated recipes, wrong unit mappings, stale prices |
| Sales mix and production mismatch | Operational | Prepped for 200 covers, only 160 showed up |
When we analyse the gap between ideal and actual food cost, we see the following:
1. Portioning and production errors
Usually, the biggest driver. Cooks eyeball portions instead of weighing, plating varies between shifts, prep staff cut differently than the recipe assumes—a few extra grams per plate compound across hundreds of covers a day.
Yield factors play a role, too. If your recipe assumes 85% yield on a protein, but the team is getting 78%, that 7-point gap flows straight into your variance. These discrepancies only surface when you compare theoretical against actual at the ingredient level.
2. Waste and spoilage that goes unrecorded
Expired product, prep trimmings beyond what the recipe accounts for, dropped items, returned dishes. All are normal in a professional kitchen, but the problem arises when they aren’t logged. The waste still impacts your actual food cost, but there’s no record explaining why the number is high.
Reducing waste has a massive impact on profitabilty. Global research from Champions 12.3 found that for every dollar restaurants invested in reducing food waste, they saved about $7 in operating costs.
Industry estimates put food waste at 4–10% of purchases. On €50k/month in food spend, that’s €2,500–€5,000 in waste alone.
3. Theft and unrecorded consumption
Staff meals that aren’t tracked, tastings during service, and product walking out the door. Almost invisible in the numbers unless you’re tracking variance at the ingredient level, where unusual patterns in specific items are often the first signal.
4. Procurement and receiving errors
Supplier prices creep up without recipe costs being updated. Deliveries come in short or with substitutions that don’t get reflected in the system. The USDA Food Price Outlook shows food-away-from-home prices rose 3.9% in February 2026 versus the prior year. When recipe costs aren’t updated to match, margins erode quietly.
As one hotel group operator put it, “chocolate doubled in price recently” — a reminder that manual price updates can’t keep pace with how fast costs move.
5. Inventory counting errors
If your stock count is off, your actual food cost is wrong — and the variance you’re looking at isn’t an operational problem, it’s a data problem: inconsistent methods, untrained staff, confusion between units and weight.
One operations admin at a Dutch hospitality group described finding ‘tremendous discrepancies’ during counts. Most of the stock variance turned out to be bad data, not real operational loss.
6. Recipe and system data problems
Recipes that aren’t updated, missing sub-recipes, ingredients mapped to the wrong supplier product, stale prices. This corrupts the theoretical side entirely. Even if the kitchen executes perfectly, variance looks bad because the benchmark is wrong.
7. Sales mix and production mismatch
Theoretical food cost is calculated from what the POS says you sold. Anything the kitchen produces that doesn’t go through the POS creates a gap; the actual cost goes up while the theoretical cost stays the same.
Buffets and banquets are the clearest example: prep for 200 covers, 160 show up, and 40 covers of overproduction hit actual with nothing on the theoretical side. But it happens in à la carte too — staff meals, complimentary dishes, off-menu requests, and tastings all use ingredients without generating a matching sale.
What is a good food cost variance percentage?
There’s no universal number. The most useful benchmark is your own best-performing site. If your tightest-run restaurant hits 2.1% and another site on the same menu comes in at 4.8%, you don’t need an industry benchmark to know there’s a problem.
That said, these ranges provide a starting point. Below 2% is excellent, but few operations sustain it. 2–5% is acceptable for most multi-site operations. Above 5%, something structural is usually off: bad recipe data, unreliable counts, or consistent portioning problems. Above 8%, you’re likely dealing with multiple issues compounding, or with a data foundation so broken that the variance looks worse than it really is.
Benchmarks also differ by operation type:
| Operation type | Acceptable variance | Red flag |
|---|---|---|
| QSR | 1.5–3% | Above 3% |
| Fast casual | 2–4% | Above 4% |
| Full service | 3–5% | Above 5% |
How to read these numbers
- The trend matters more than any single reading. A site running steady at 3% is in better shape than one swinging between 1% and 7%. The inconsistency means the operation isn’t under control, even if individual periods look fine.
- Compare like with like: a QSR with 15 items will naturally achieve lower variance than a full-service restaurant with 80 dishes and substantial manual prep.
- Your baseline matters more than any benchmark. If you’re currently at 6% and bring it down to 4%, that’s a significant margin improvement. Start from where you are.
- Zero variance isn’t the goal either. Some variance is operational reality — trim loss, training waste, recipe testing, staff meals. The goal is to separate what you can control from what you can’t, and drive the controllable part down.
- What’s not acceptable is not knowing your variance at all.
The case for ingredient-level tracking
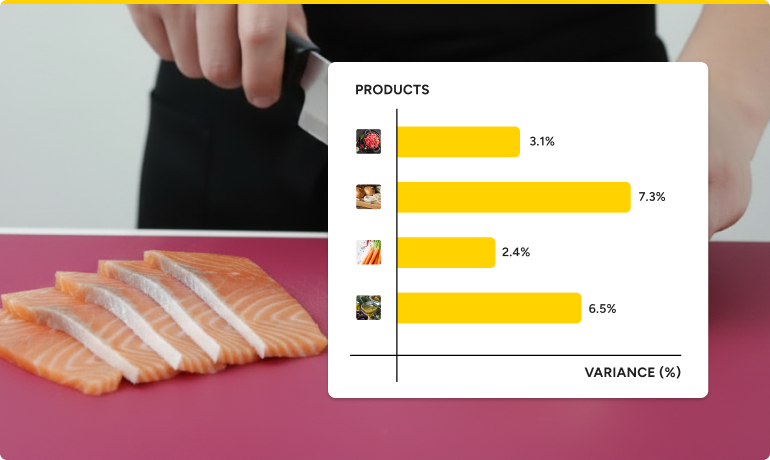
Everything up to this point describes variance as a single number. That’s your baseline check — but it’s a blended number that aggregates variance across all your products.
Aggregate food cost variance tells you there’s a problem; ingredient-level variance tells you which problem, whether it’s over-portioning, waste, theft, or a pricing error.
A 4% variance looks moderate until you break it open and find proteins running at 10% while dry goods sit at 0.5%. The items destroying your margin are averaged out of visibility.
You can’t act on an aggregate number because it doesn’t tell you whether chefs are putting too much chicken breast on a caesar salad, a supplier has quietly bumped prices on dairy, a unit-of-measure error is making olive oil look out of control (when it’s not), or 12kg of salmon has gone missing with nobody able to account for it.
A 24-unit pizza chain found that a single ingredient had created €91,000 in uncontrolled losses. The variance report flagged an issue, but only by drilling down to the ingredient level did they understand the magnitude. “It shifted the conversation entirely from ‘I have a problem to a targeted investigation”, says the F&B director.
Ellen Snel, Data Analyst at Restaurant Company Europe, confirms: “By monitoring cost discrepancies, we know exactly when and why we’re losing money, and we can address the issue directly.”
Ingredient-level variance turns a number people shrug at into a signal people act on. “We’re missing 12kg of salmon this month” is something your team can investigate. “Our food cost is a bit too high” is not.
In Apicbase Analytics, this level of food cost analysis is visible per ingredient, per recipe, per site, and per period — so you can drill from a portfolio-level dashboard down to a single ingredient at any specific location.
How to track food cost variance at ingredient level
Four data streams need to stay up to date. In Apicbase, this happens automatically.
1. Recipe cards with full ingredient detail
Every dish needs a costed recipe with ingredients, quantities, units, yield factors, and sub-recipes. If a burger recipe says 180g beef patty, 30g cheddar, 15ml sauce, and a 95g bun, those are the quantities the system uses to calculate theoretical usage based on what was sold.
Sub-recipes matter because many components are made in batches but used per portion — a bolognese sauce, for example. Yield factors matter, too: if you buy a whole chicken but your recipe calls for portioned breast, the system needs to know the conversion.
Apicbase Inventory Management handles this automatically. Sub-recipes nest unlimitedly, with cost, allergens, and nutrition rolling up through every level.
2. Current purchase prices
Every ingredient needs a current price linked to the supplier product you actually buy. When prices change — and they change constantly — the system needs to reflect that. In Apicbase, supplier integrations automatically update procurement data.
3. Sales mix data from your POS
The system multiplies each dish’s ingredient requirements by the number sold to calculate theoretical consumption per ingredient. If your POS data is incomplete — comps not recorded, staff meals not rung through, waste not logged — the theoretical side understates what should have been used.
Apicbase integrates directly with your POS, so sales data, stock levels, and dashboards stay in sync.
4. Accurate inventory counts
The quality of your counts determines the quality of your inventory variance — and everything downstream of it.
As Craig Goslin at Redemption Roasters put it: “In the past, managers were doing a weekly stocktake simply so that the accounts team had an opening stock value. But no one was actually bothering to look at a variance report and understand actual versus theoretical.”
Most operations still count on pen and paper. It’s tedious, slow, and unreliable, and when counting is a chore done for accounting rather than operations, nobody looks at what the numbers are telling them.
As Peter Schimpl, VP of Digital and IT at L’Osteria, puts it: “Inventory management, for me, is about getting data. And the challenge is motivating people to enter the data correctly.”
Apicbase offers barcode scanning, voice counting, and photo counting in the mobile app. It makes the process less of a chore. Restaurant managers get instant performance feedback. Finance and operations get the numbers directly.
“After only a few months, we had managed to decrease food costs by about 2% across the chain, and we spent a lot less time on stock counting,” reveals Tosca Eggenhuizen, Product Owner F&B Systems, CitizenM, now part of Marriott.
How food cost variance works across multiple sites

The principles are the same — theoretical versus actual — but the complexity multiplies. So do the opportunities to find savings.
Centralised recipes, localised execution
Recipe standards should be defined centrally. Every location works from the same recipes, the same portions, the same specifications.
Site-to-site comparison is your most powerful diagnostic
Line up the same metric across locations, and outliers become obvious. If 8 out of 10 sites run at a beef variance of 2–4%, and two sites run at 8–9%, you know where to focus.
Supplier and pricing differences
Multi-site operations often have different suppliers or negotiated prices by region. Theoretical cost can legitimately differ between locations for the same dish. Your system needs to apply each site’s actual purchase prices to the same recipe rather than using a single blended price. Otherwise, you’ll see variance that’s really just a pricing difference, not an operational problem. Apicbase handles this automatically.
Transfers between sites
Every transfer that isn’t recorded throws off both sites’ actual food cost. If site A sends 20kg of chicken to site B but nobody logs it, site A looks artificially good and site B looks artificially bad. Transfer tracking needs to be airtight.
In Apicbase, product transfers are tracked via the transfer dashboard and inventory module.
Central production layer
Central kitchens create a variance problem most operators don’t anticipate: the equation splits in two: production variance at the central kitchen (did we use the right amount of ingredients to produce the expected output?) and consumption variance at the receiving sites (did we use the right amount of finished product relative to sales?). Both need tracking, and they need to connect.
Apicbase tracks stock usage at the central production unit and restaurant sites. Finished and semi-finished products deplete inventory at the CPU and increase it locally.
From portfolio view to single ingredient
At management level, you want a dashboard — overall variance by site, ranked and trended. The real value is in the path down: site tells you where the problem is, category tells you what kind of problem it is, and ingredient tells you exactly what’s going wrong.
Apicbase’s dashboards let you move between these levels, from the portfolio view down to a single ingredient at a single location in a single period.
Set targets from your own data
Cross-site data lets you set benchmarks based on what your own operation achieves. If your best sites run 1.5% variance, that becomes the internal target. You’re not asking other sites to hit an abstract number — you’re asking them to match what their peers have already demonstrated is possible.
The real advantage of multi-site variance tracking is pattern recognition. When the same ingredient runs high across multiple locations, that’s likely a supplier or recipe problem. When one site runs consistently high across all categories, that’s a management or training issue. The multi-site view turns isolated data points into actionable patterns.
How to reduce food cost variance
Portioning, receiving, and waste logging are the big operational levers — we cover them in depth in our guide on how to reduce food cost in restaurants. Here we’ll focus on what’s specific to getting variance under control.
Craig Goslin, Head of Hospitality at Redemption Roasters, said it best: “We needed real-time visibility and the ability to track performance daily rather than relying on weekly numbers. Then the horse has already bolted.”
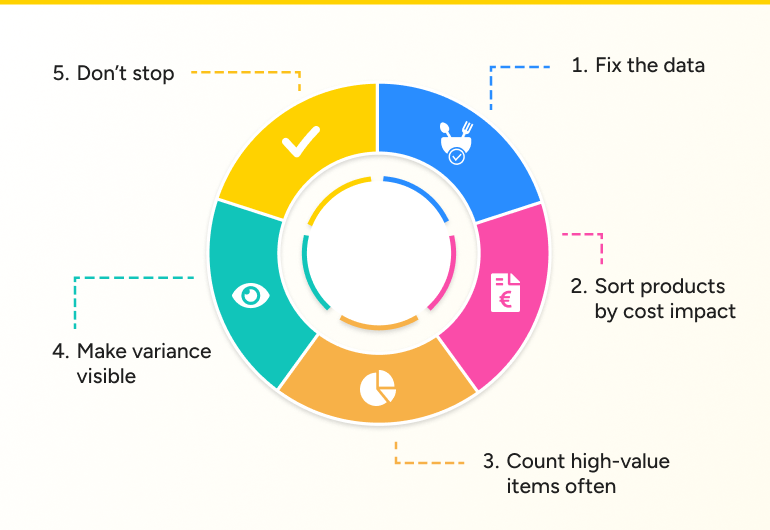
1. Fix the data first
Audit your top 20 ingredients by spend. If recipes are outdated, prices are stale, or counts are unreliable, you’re chasing phantom variance.
2. Sort by cost impact, not percentage
A 15% variance on parsley is noise. A 4% variance on salmon could amount to thousands per month.
3. Count high-value items more often
A weekly count on your 15 most expensive ingredients catches problems before they compound for a full month. A portioning issue that costs €500 in week one costs €15,000 by the time a monthly reconciliation surfaces it.
4. Make variance visible to the people who control it
When a chef knows their beef variance is 8% and the target is 3%, behaviour changes in a way that telling kitchens to “be more careful” never will.
5. Don’t stop
Most operations get the fixes right; they just stop doing them after a few weeks. Operations that commit to weekly inventory tracking see a 3–6% improvement in food cost within a single quarter, according to analysts’ estimates. Build variance review into your weekly rhythm.
From metric to management tool
Restaurant operators who get food cost variance under control do three things:
- They keep theoretical costs up to date: recipes are linked to live purchase prices instead of outdated spreadsheets.
- They invest in counting methodology: they count more often and more accurately, using tools that make the process fast enough for teams to actually do it.
- They track variance at the ingredient level rather than managing from an aggregate food cost line in the P&L, because “we’re losing 12kg of salmon at site 4” drives action in a way that “food cost is 2 points high” never will.
All three require the same underlying architecture: recipes, purchase prices, sales data, and inventory connected in one system, so both theoretical and actual cost flow from the same data.

Apicbase provides the data foundation for food cost control, plus handy tools for stock counting: barcode scanning, voice counting, and photo counting. They make stock takes fast and reliable, so restaurant managers will actually do them.
When variance surfaces, you drill from the portfolio level down to a single ingredient at a specific site to see exactly where the money went.