Restaurant analytics software turns raw data into powerful performance dashboards packed with insightful graphs and charts about your food costs, revenues, F&B inventory and purchasing. Track growth, spot discrepancies, and help your teams make the right call at every turn.
Updating spreadsheets is time-consuming and error-prone. So how about you leave all that data mining behind, tap into our visualisations, and get a clear overview of your BoH foundations.
Inventory
Get an overview of your inventory — stock, transfers, and variance — to control your spending and food waste.
Procurement
Visualise purchasing trends, delivery values & location procurement behaviour to optimise your food costs.
Sales
Study insights from your reconciled PoS & vendor data to make tailored profit-driving decisions for each outlet.
Check, compare & fine-tune BoH performance of all your outlets without wasting time in spreadsheets
Spreadsheets turn data reconciliation from different outlets into a nightmare. Our F&B group analytics functionality lets you skip the messy middle of number-crunching. This shortens your reaction time, so your under performing locations get the attention they need when they need it.
Collaborate with unit managers
Save your managers from drowning in data dumps by arming them with performance-building graphics & insights.
Make profit-boosting moves
You can’t trust numbers wrangled from error-prone spreadsheets. Upgrade to dashboards & level up your decision-making.
Spot underperforming locations
Nosediving locations stand out like a sore thumb. You’re no longer chasing them down — you’re building them back up… fast.
Restaurant inventory analytics dashboard
Stay on top of inventory
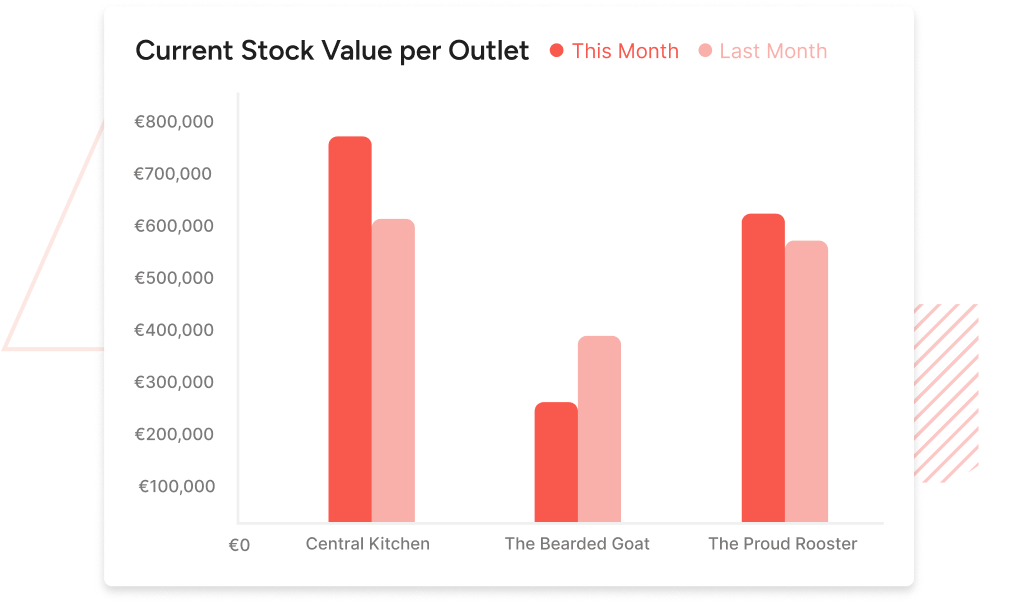
You need to keep your biggest cost centre in the crosshairs at all times… and spreadsheets don’t cut it. Our restaurant analytics software solution analyses thousands of data points — from counts to transfers — to paint an insightful picture of the state of your inventory at every outlet.
Use ‘inventory snapshots’ to always know your stock value. Control purchasing & leverage transfers to keep waste & costs down.
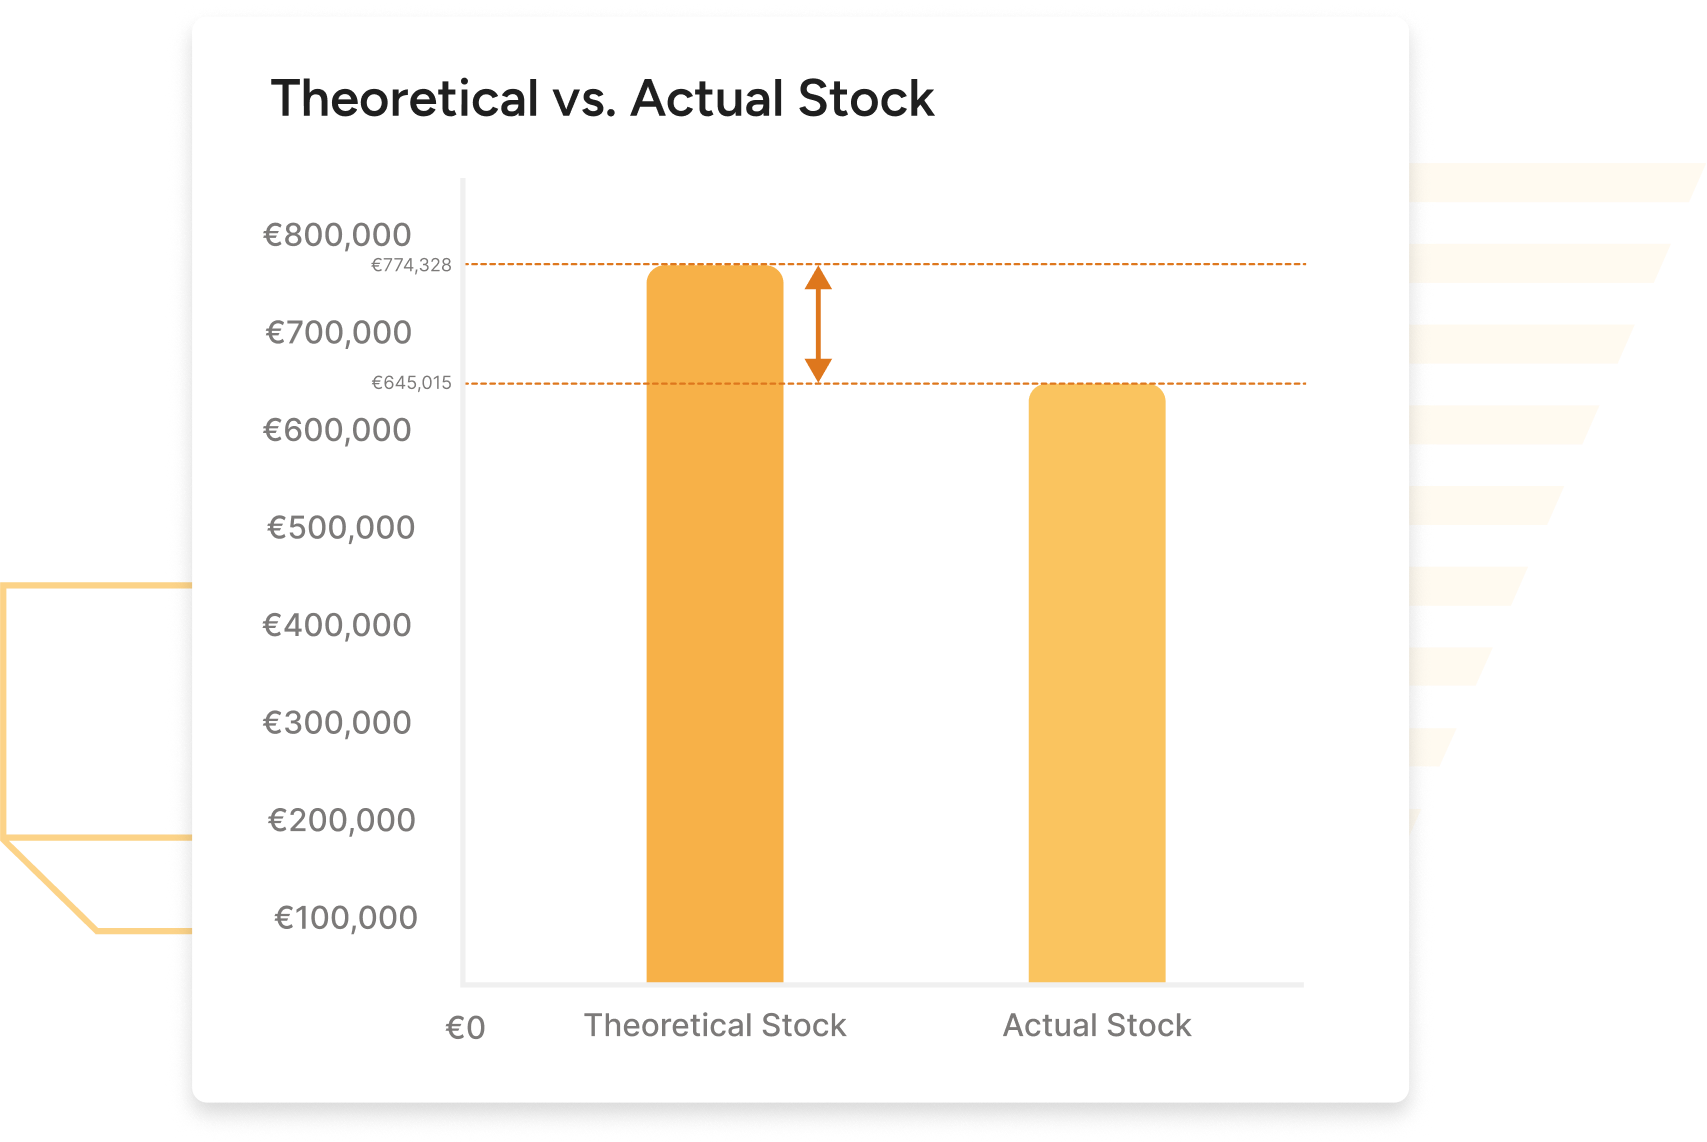
Know your variance…
… without digging for it. Keep tabs on count variance to weed out theft and errors and prevent them from eating into your bottom line.
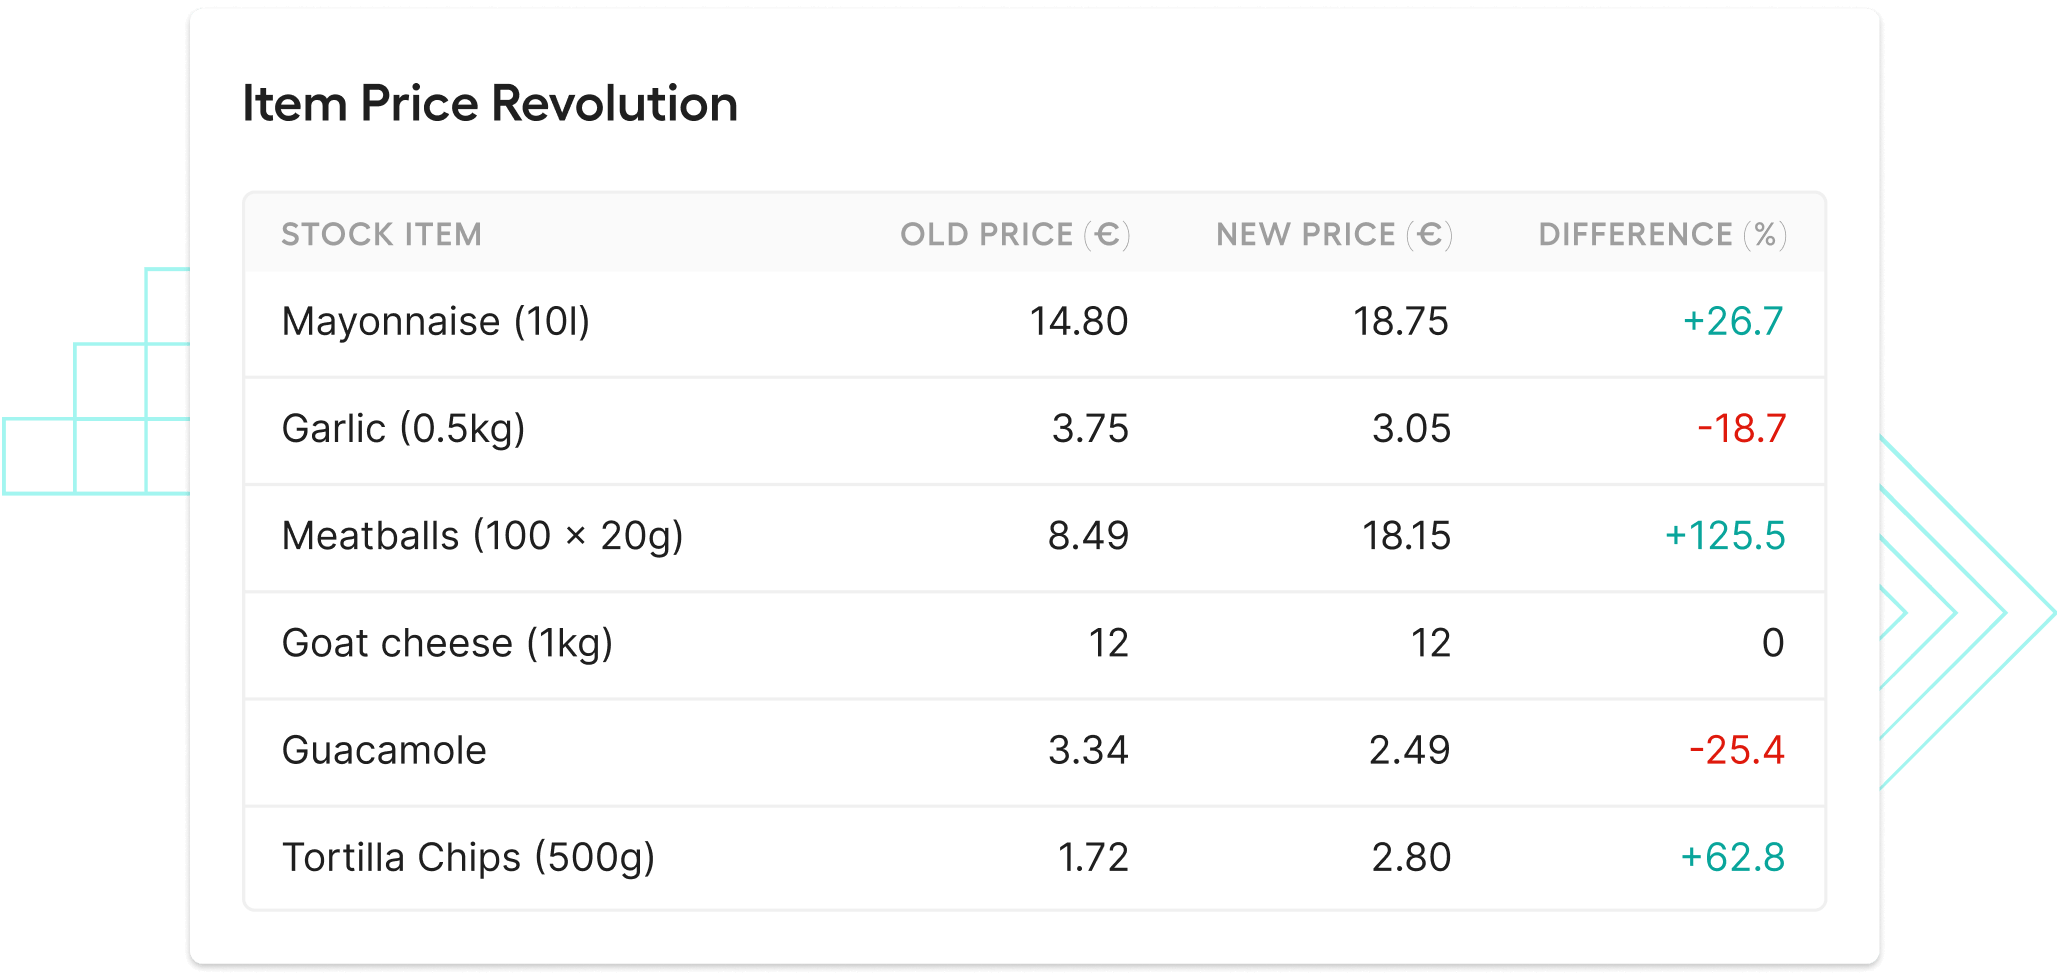
See item price evolution
When you know item price trends, you can build tighter and more profitable menus… rethink your costly recipes… and keep vendors in check.
The item price evolution dashboard is packed with value — it guides our recipe decisions and tells us when it’s time to touch base with our vendors.
Tosca Eggenhuizen
CitizenM
Restaurant procurement analytics dashboard
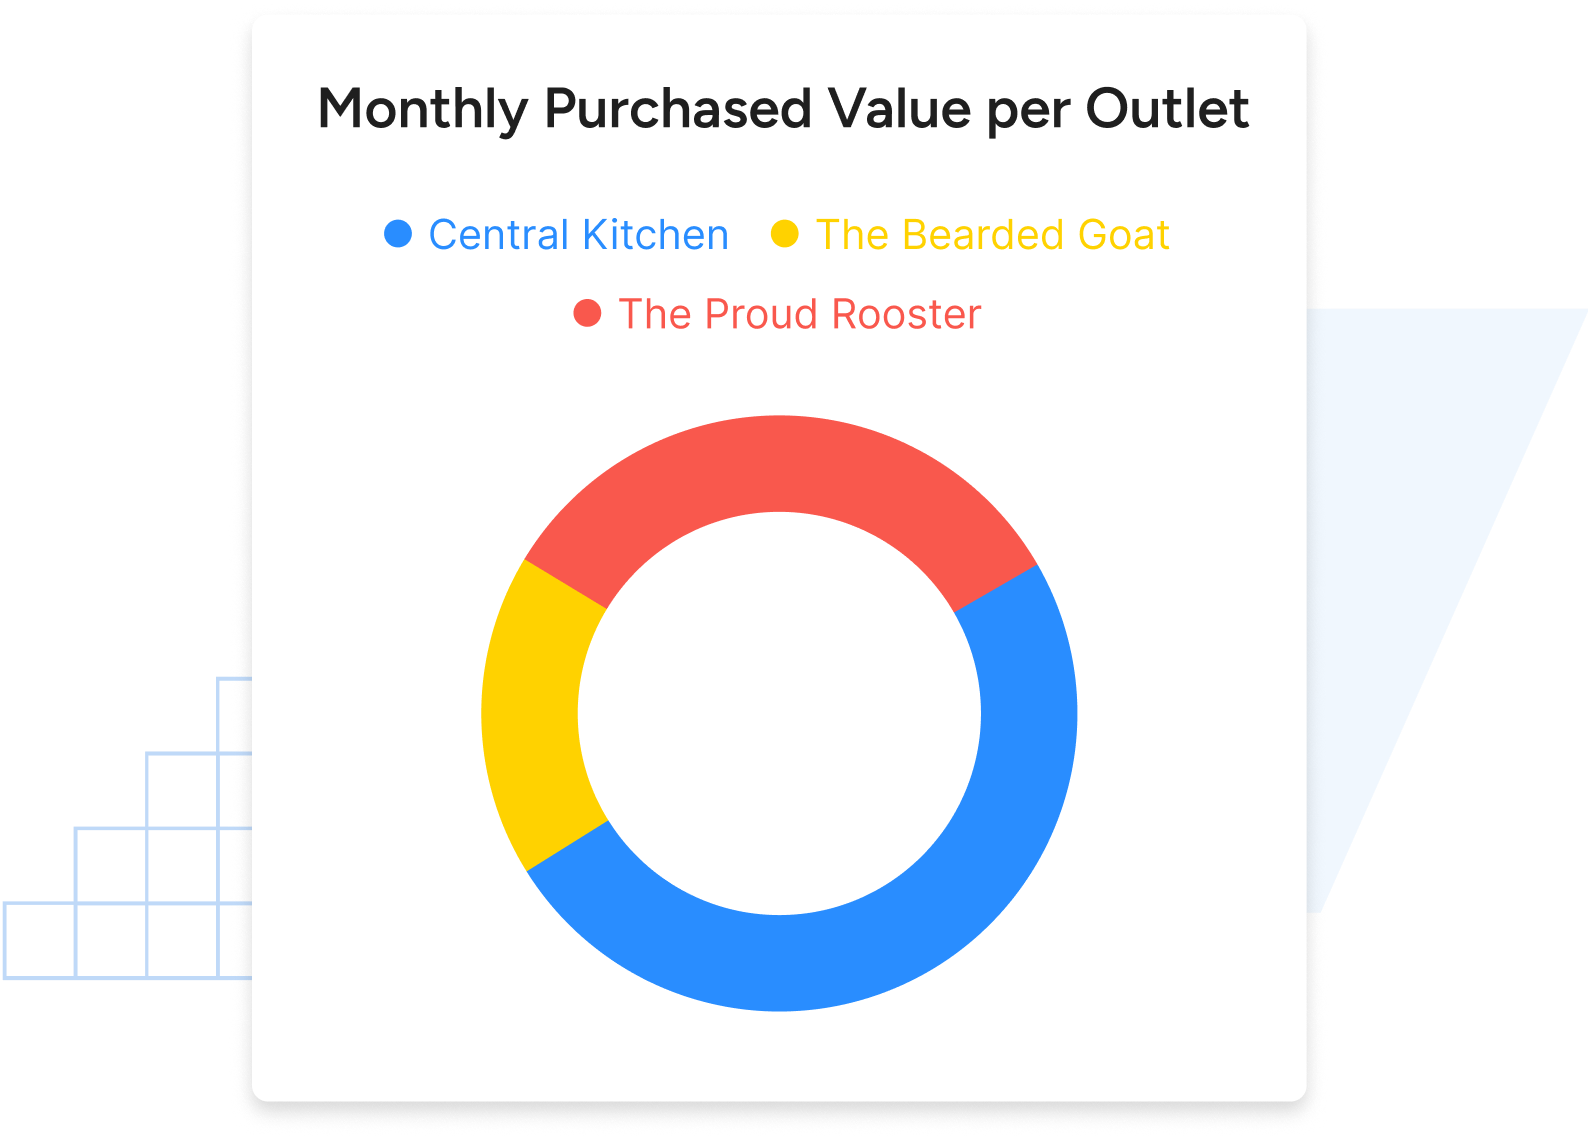
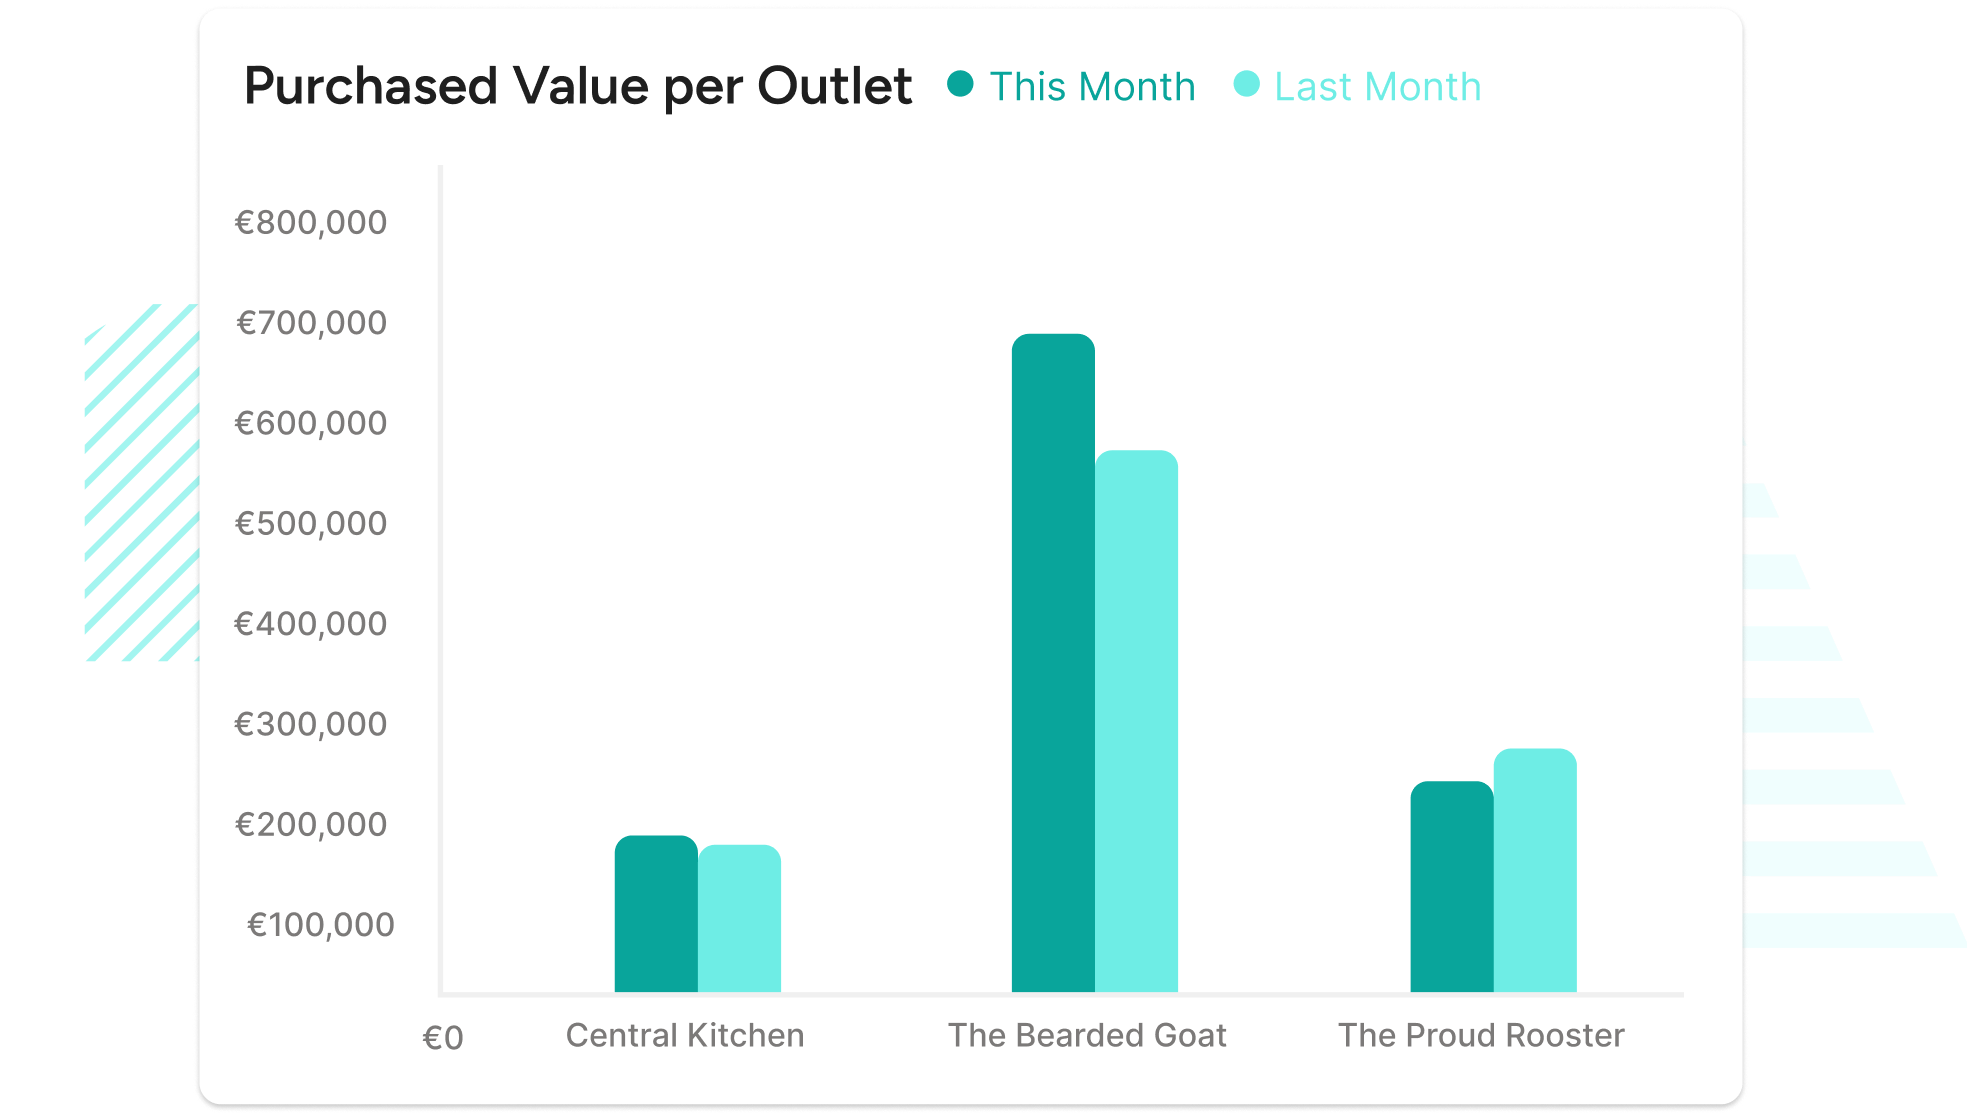
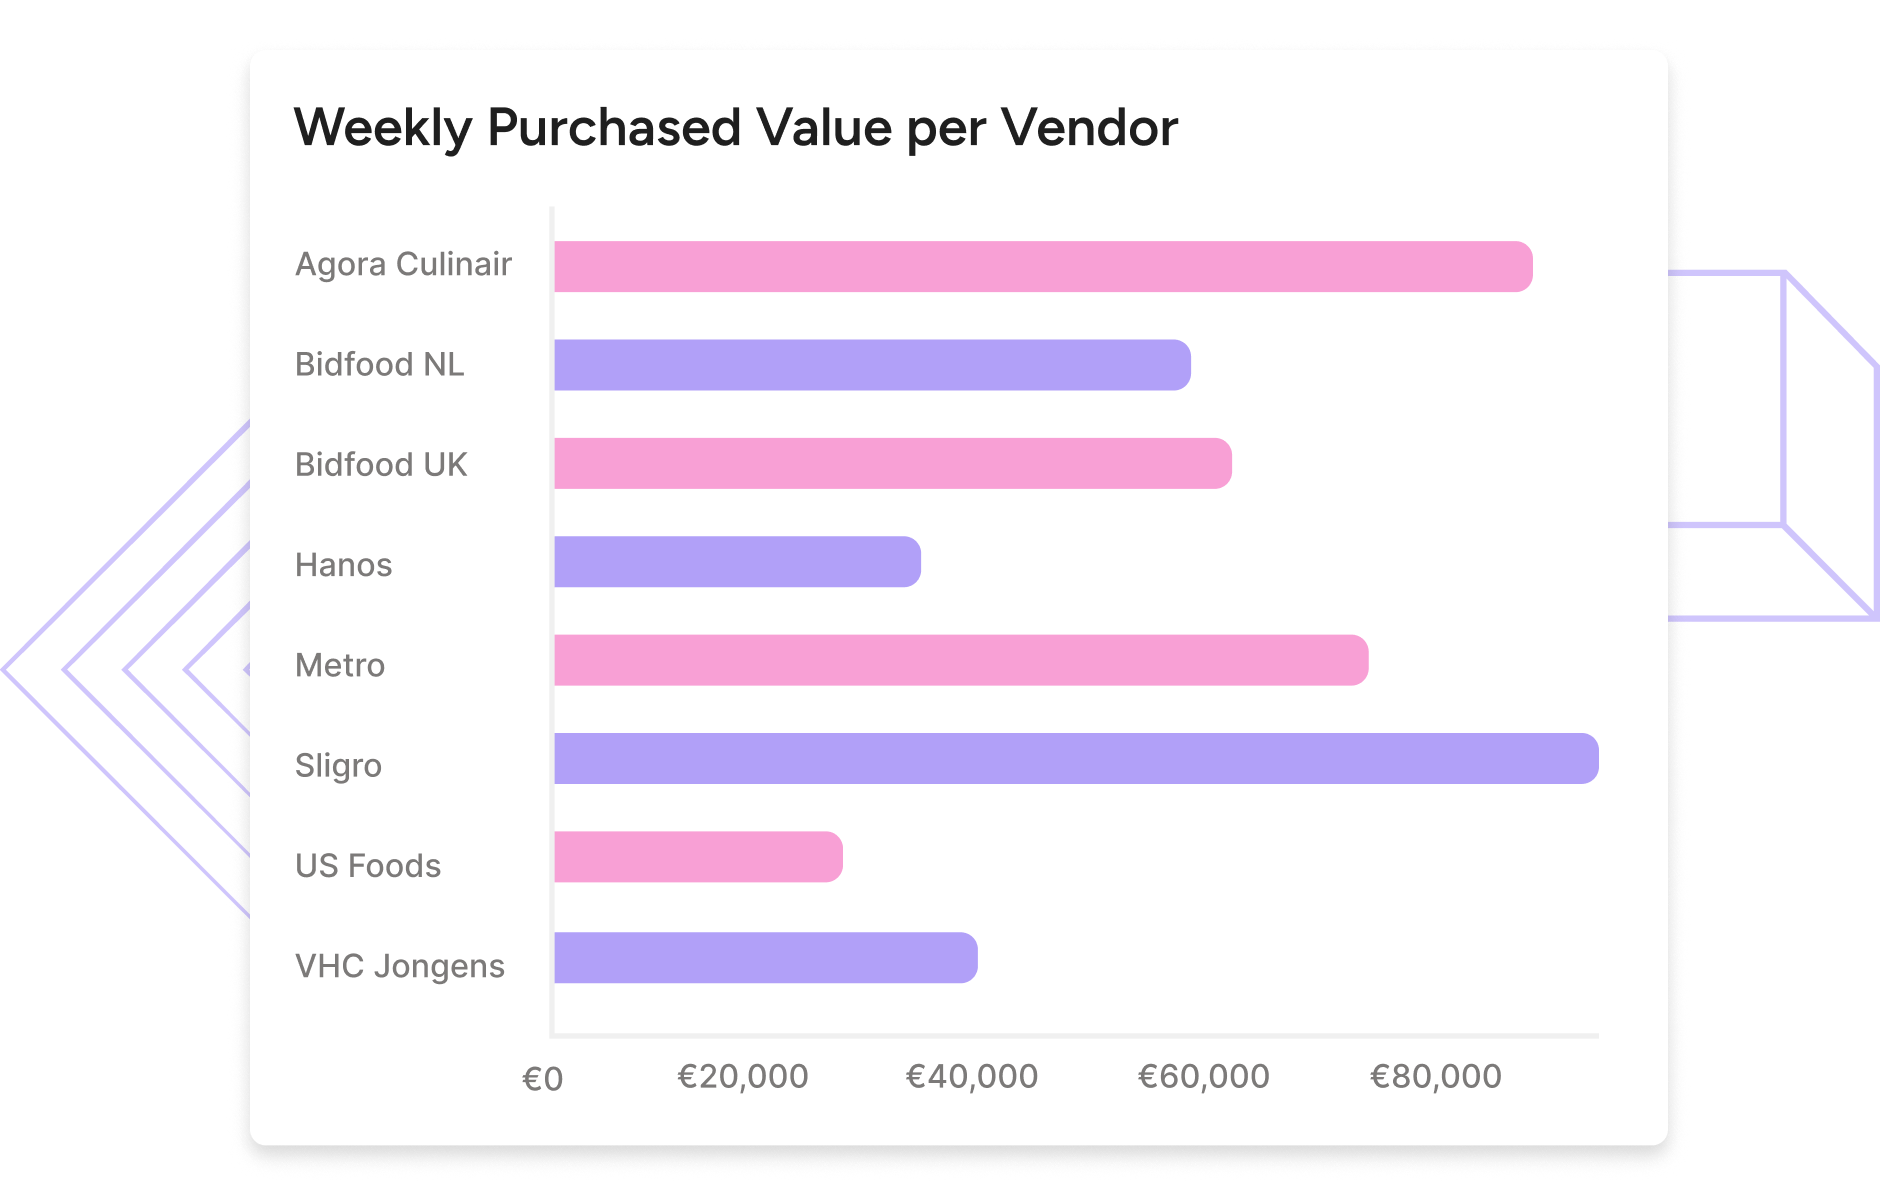
Get better deals from vendors
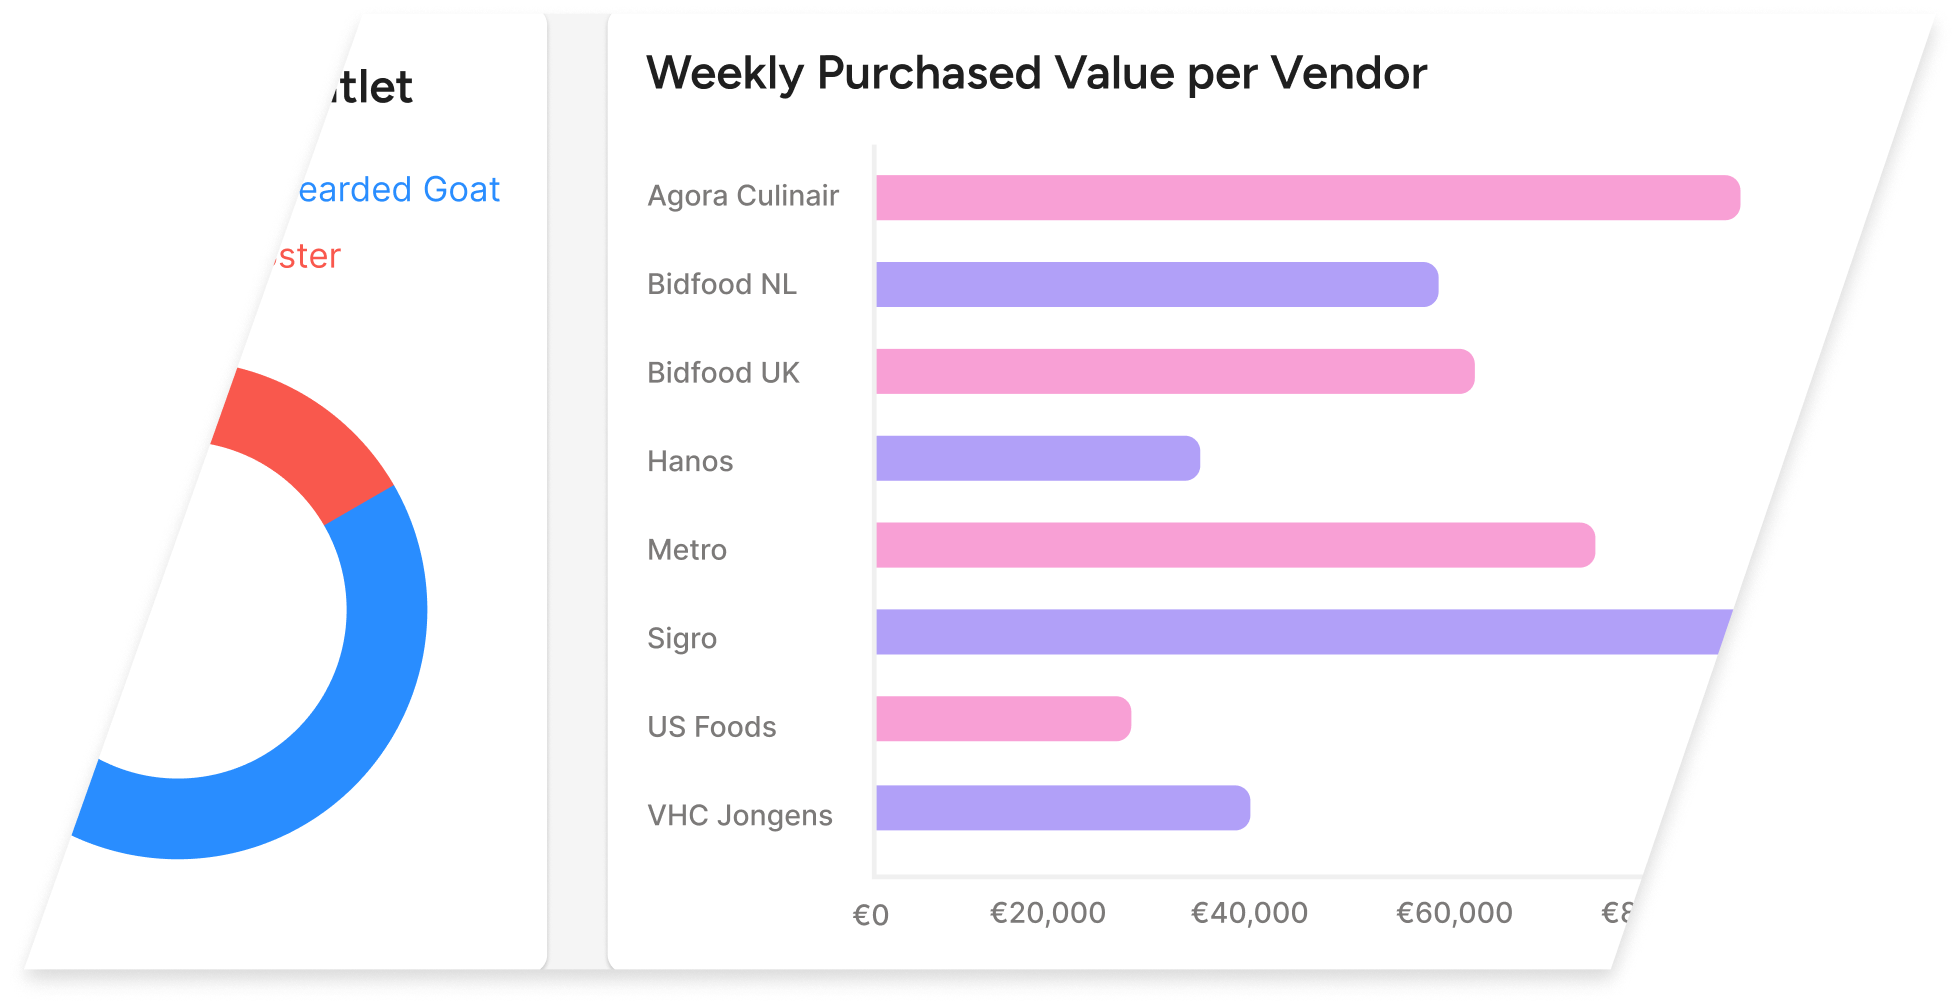
Track vendor behaviour and weekly delivery values with restaurant analytics software. Use these insights to negotiate better deals and lower your theoretical [and actual] food costs. And keep a vice-like grip on your CoGS at all times.
Monitor how much you spend with vendors at every location. Optimise deliveries to keep operational costs down.
Stop unauthorised purchasing
Identify ‘rogue’ spending location managers. Nip it in the bud. One less variance driver to worry about.
Focus on your best vendors
Find vendors with long-term potential. Build lasting partnerships. Secure optimal prices to drive growth.
Turn noisy data into clear visuals for efficient decision-making
Restaurant sales analytics dashboard
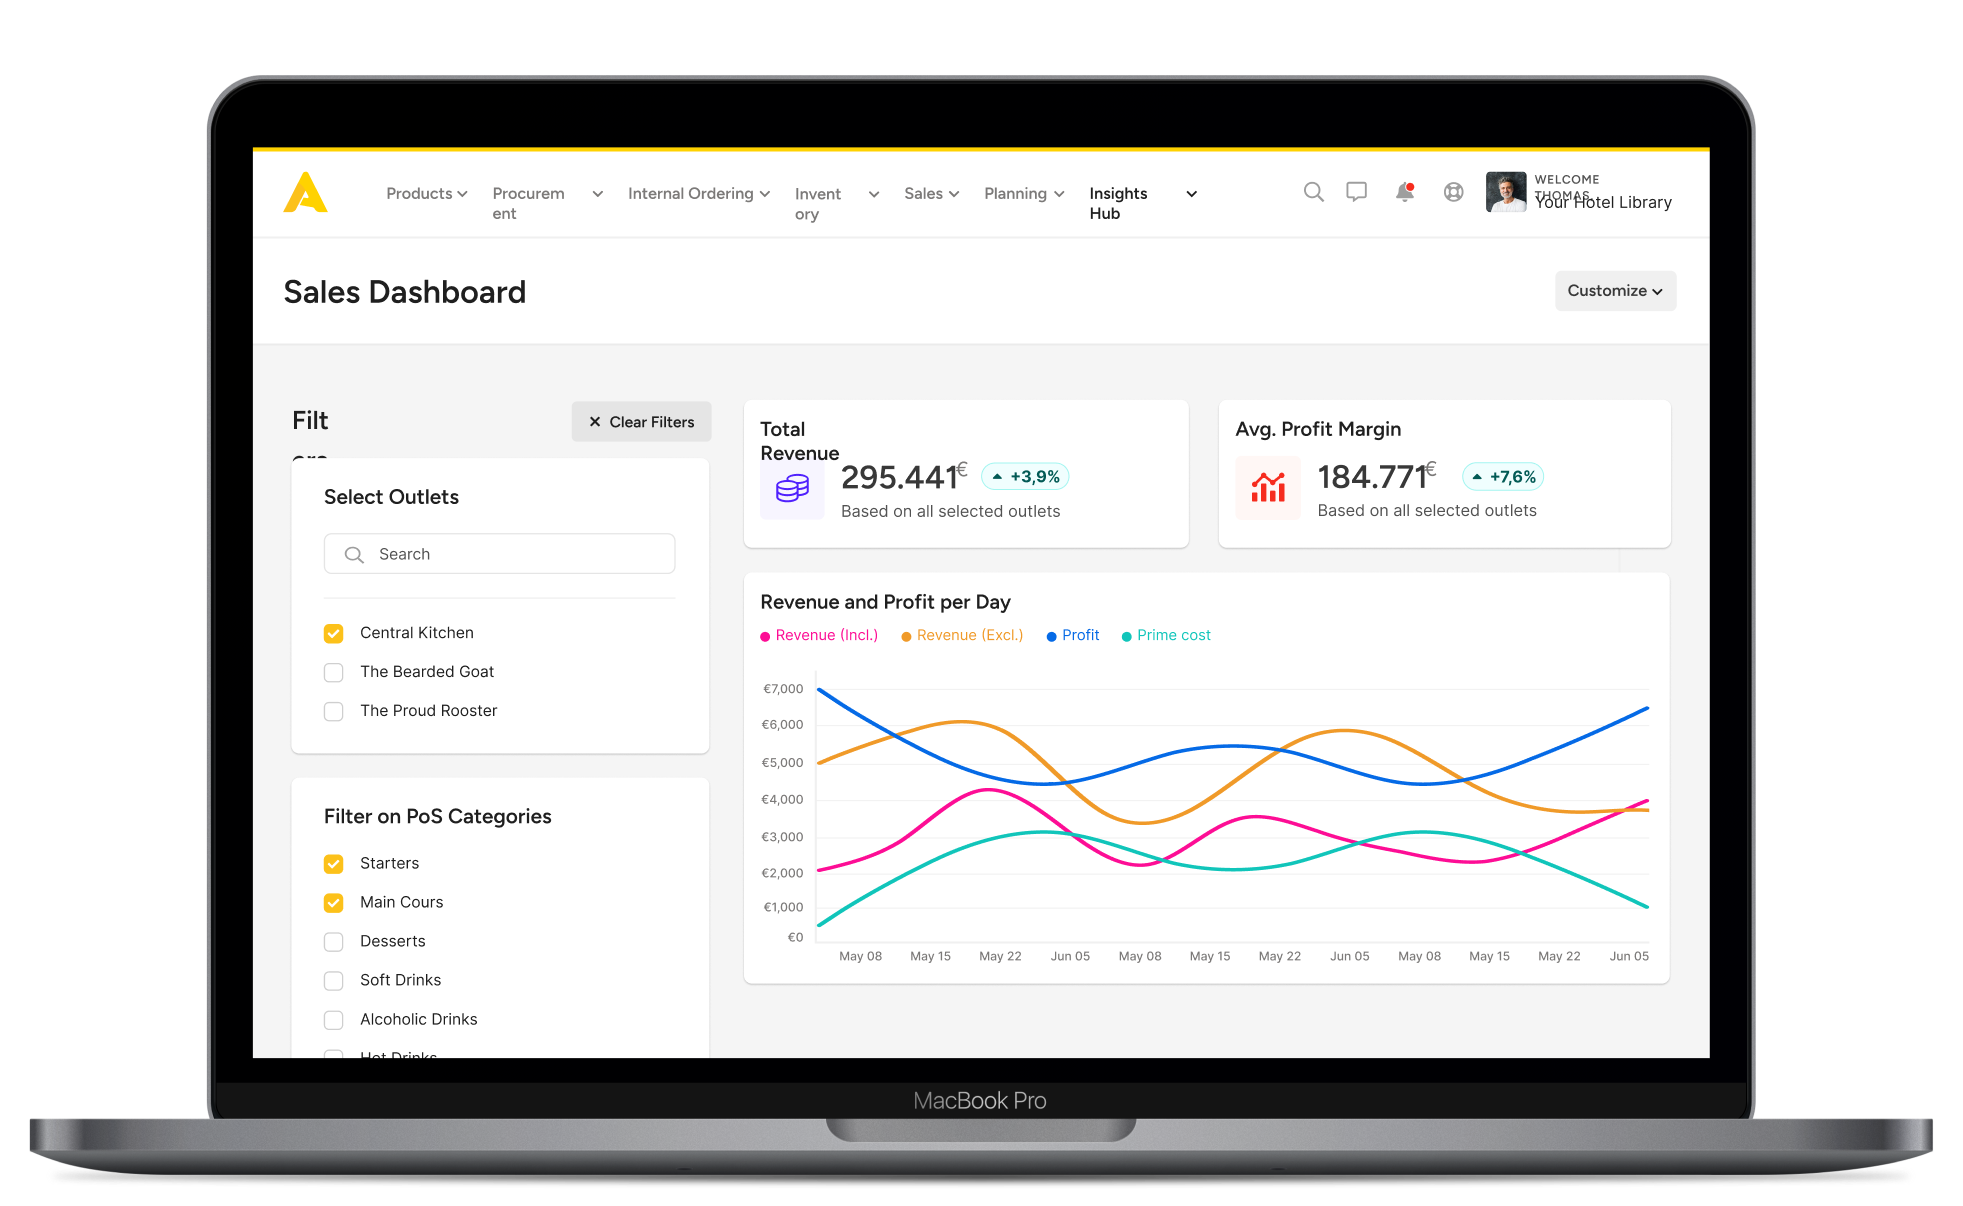
Make sales data work for you
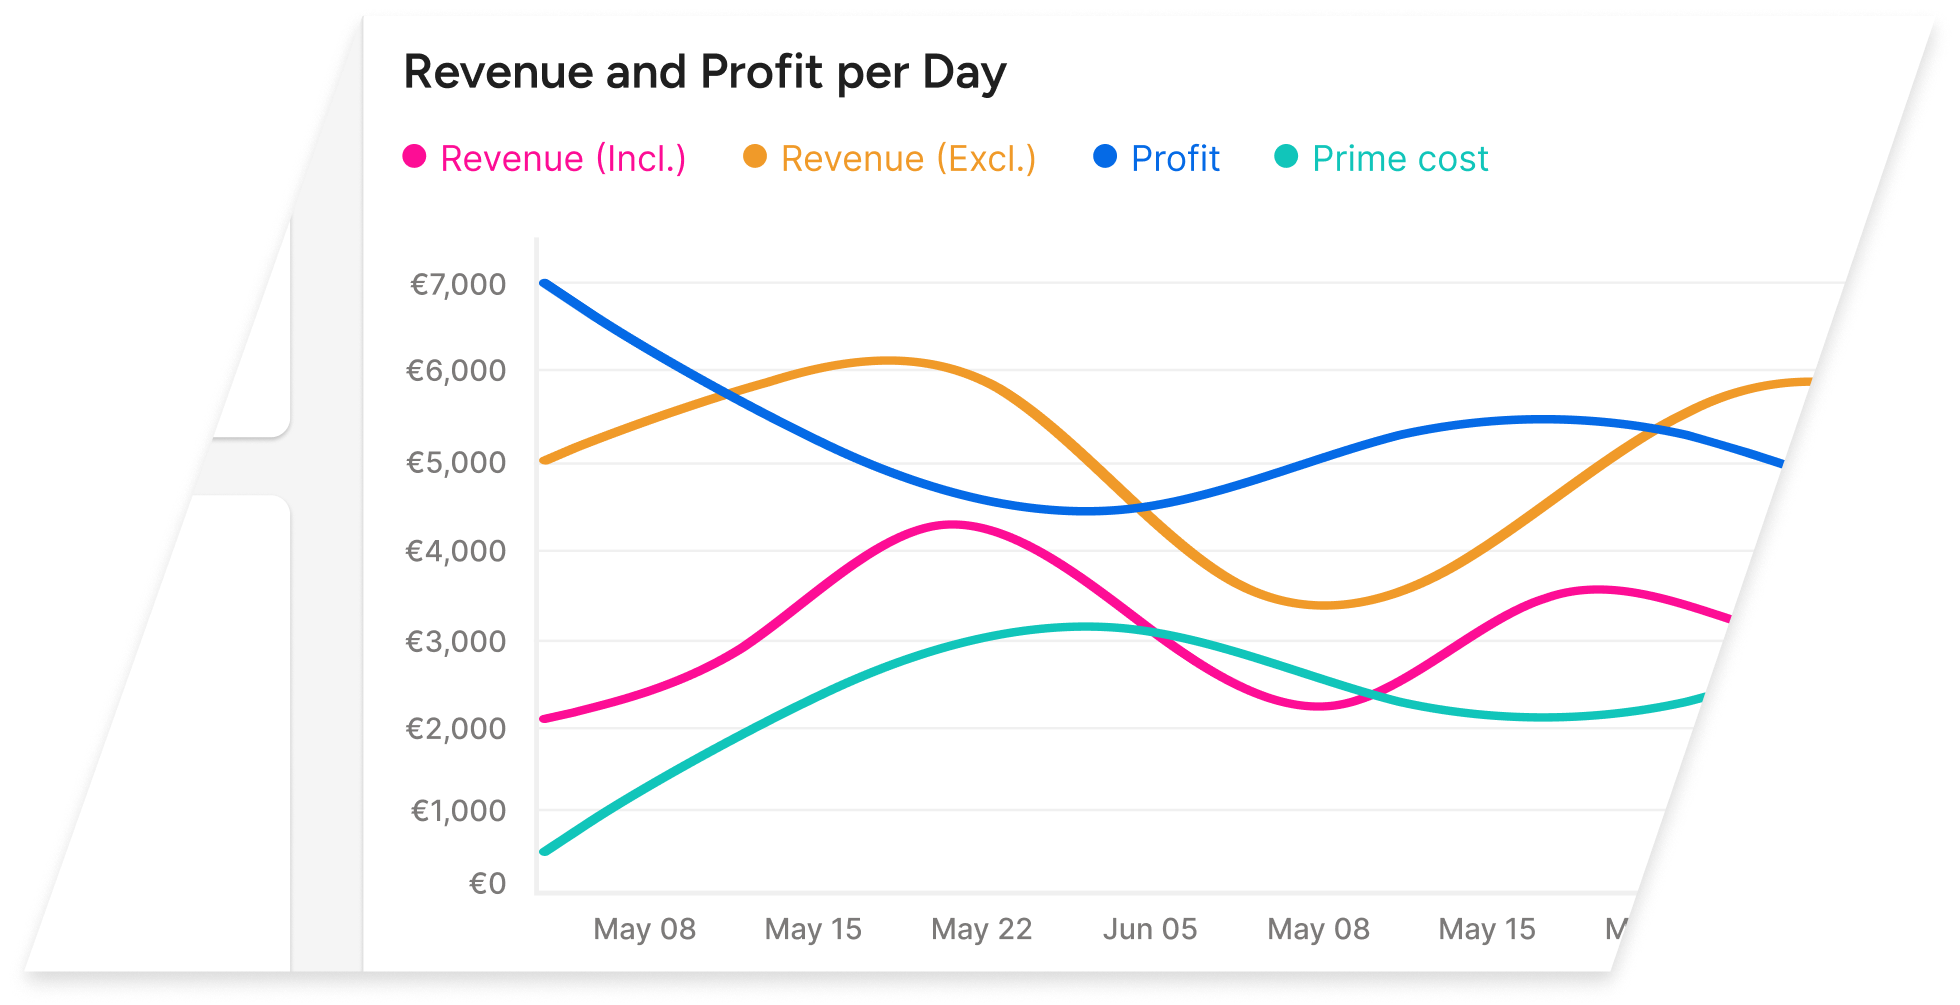
Your PoS is choke-full of profit-driving insights. The only problem? They’re buried in piles of useless data. Our restaurant reporting software turns those insights into charts and graphs, giving you an overview of sales trends so you can continually improve your menus and offers.
Track the sales evolution of your menu items, and make budget, menu & promotion plans that maximise profit.
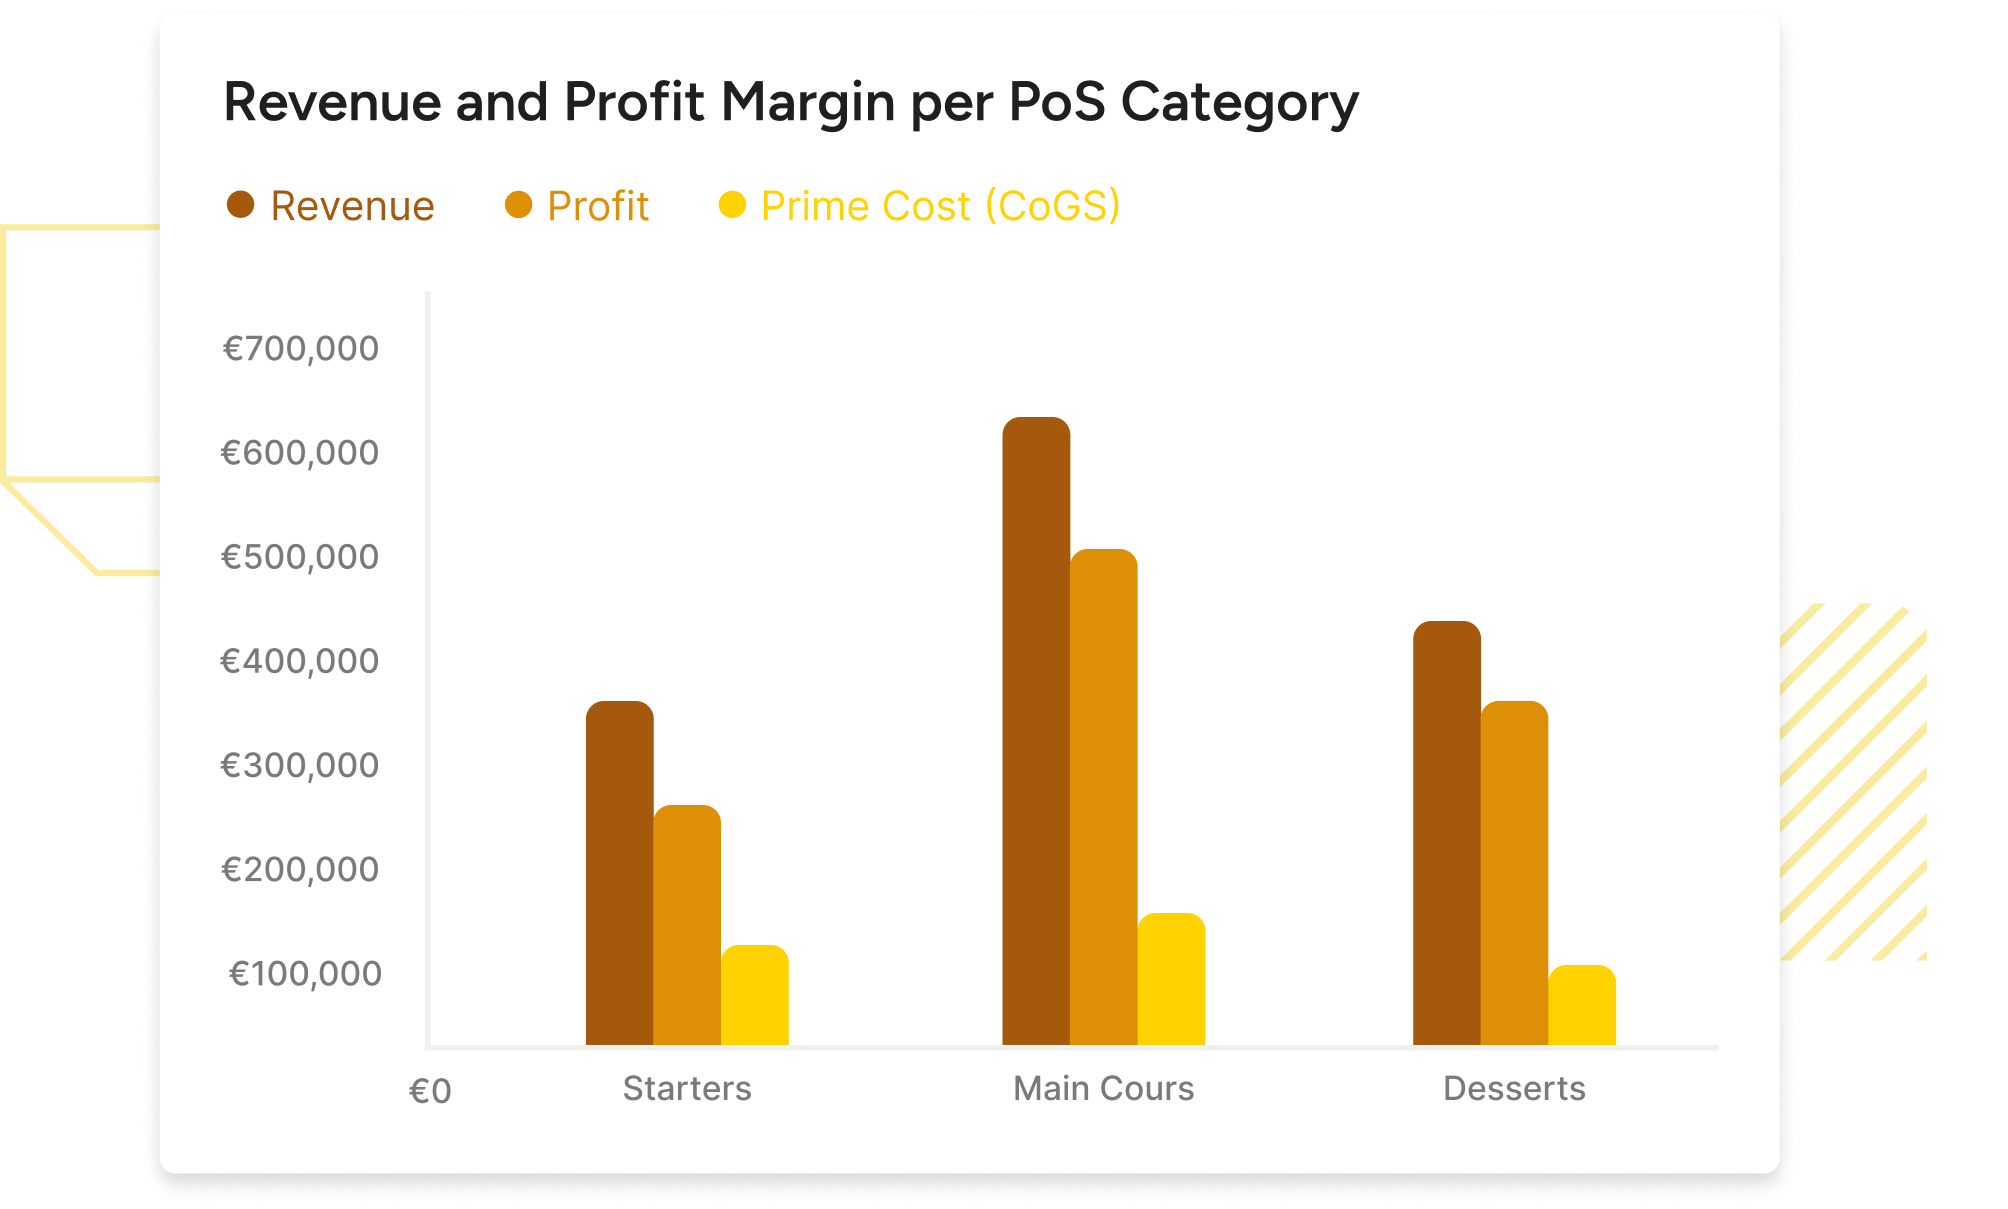
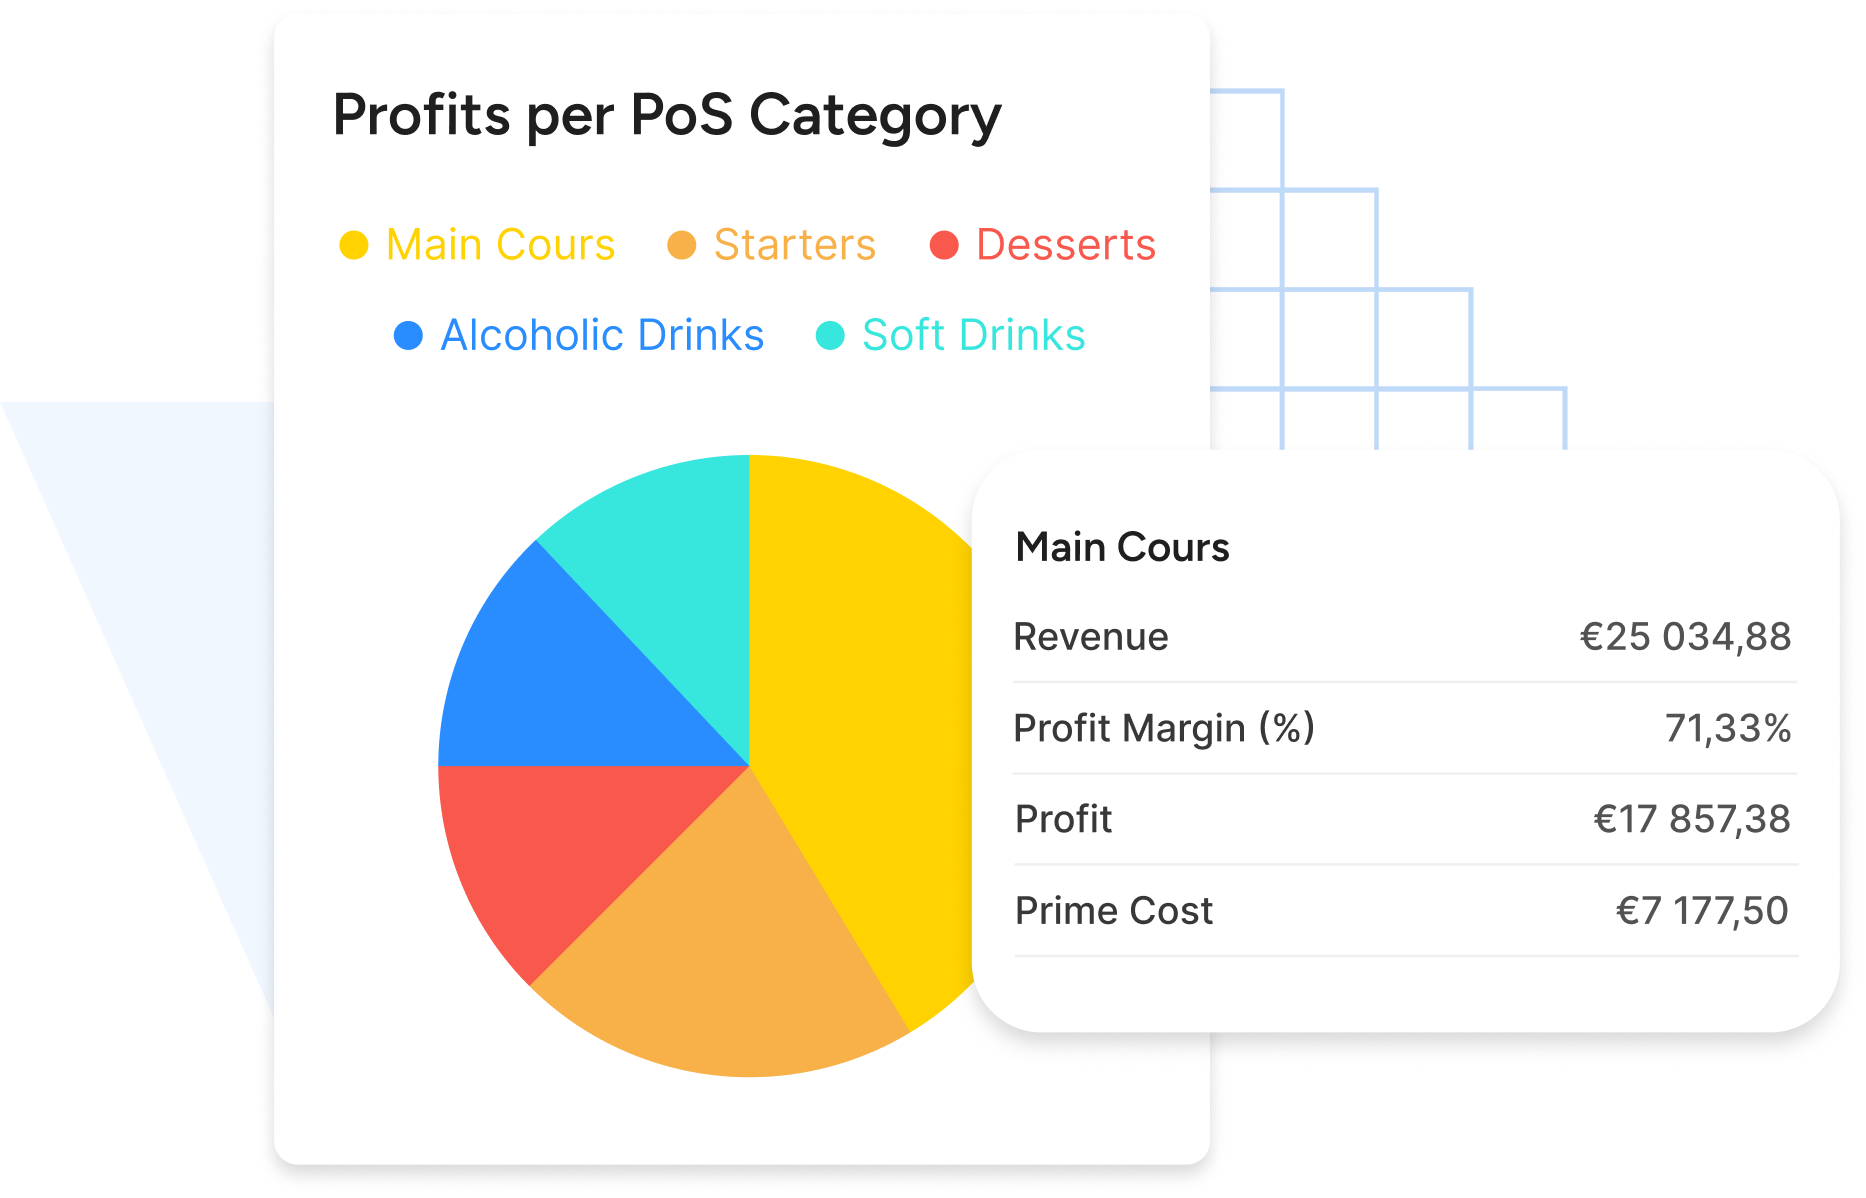
Track profit contribution per PoS category
See how each of your PoS categories is performing over time. Make the right decisions on what to cut & what to double down on.
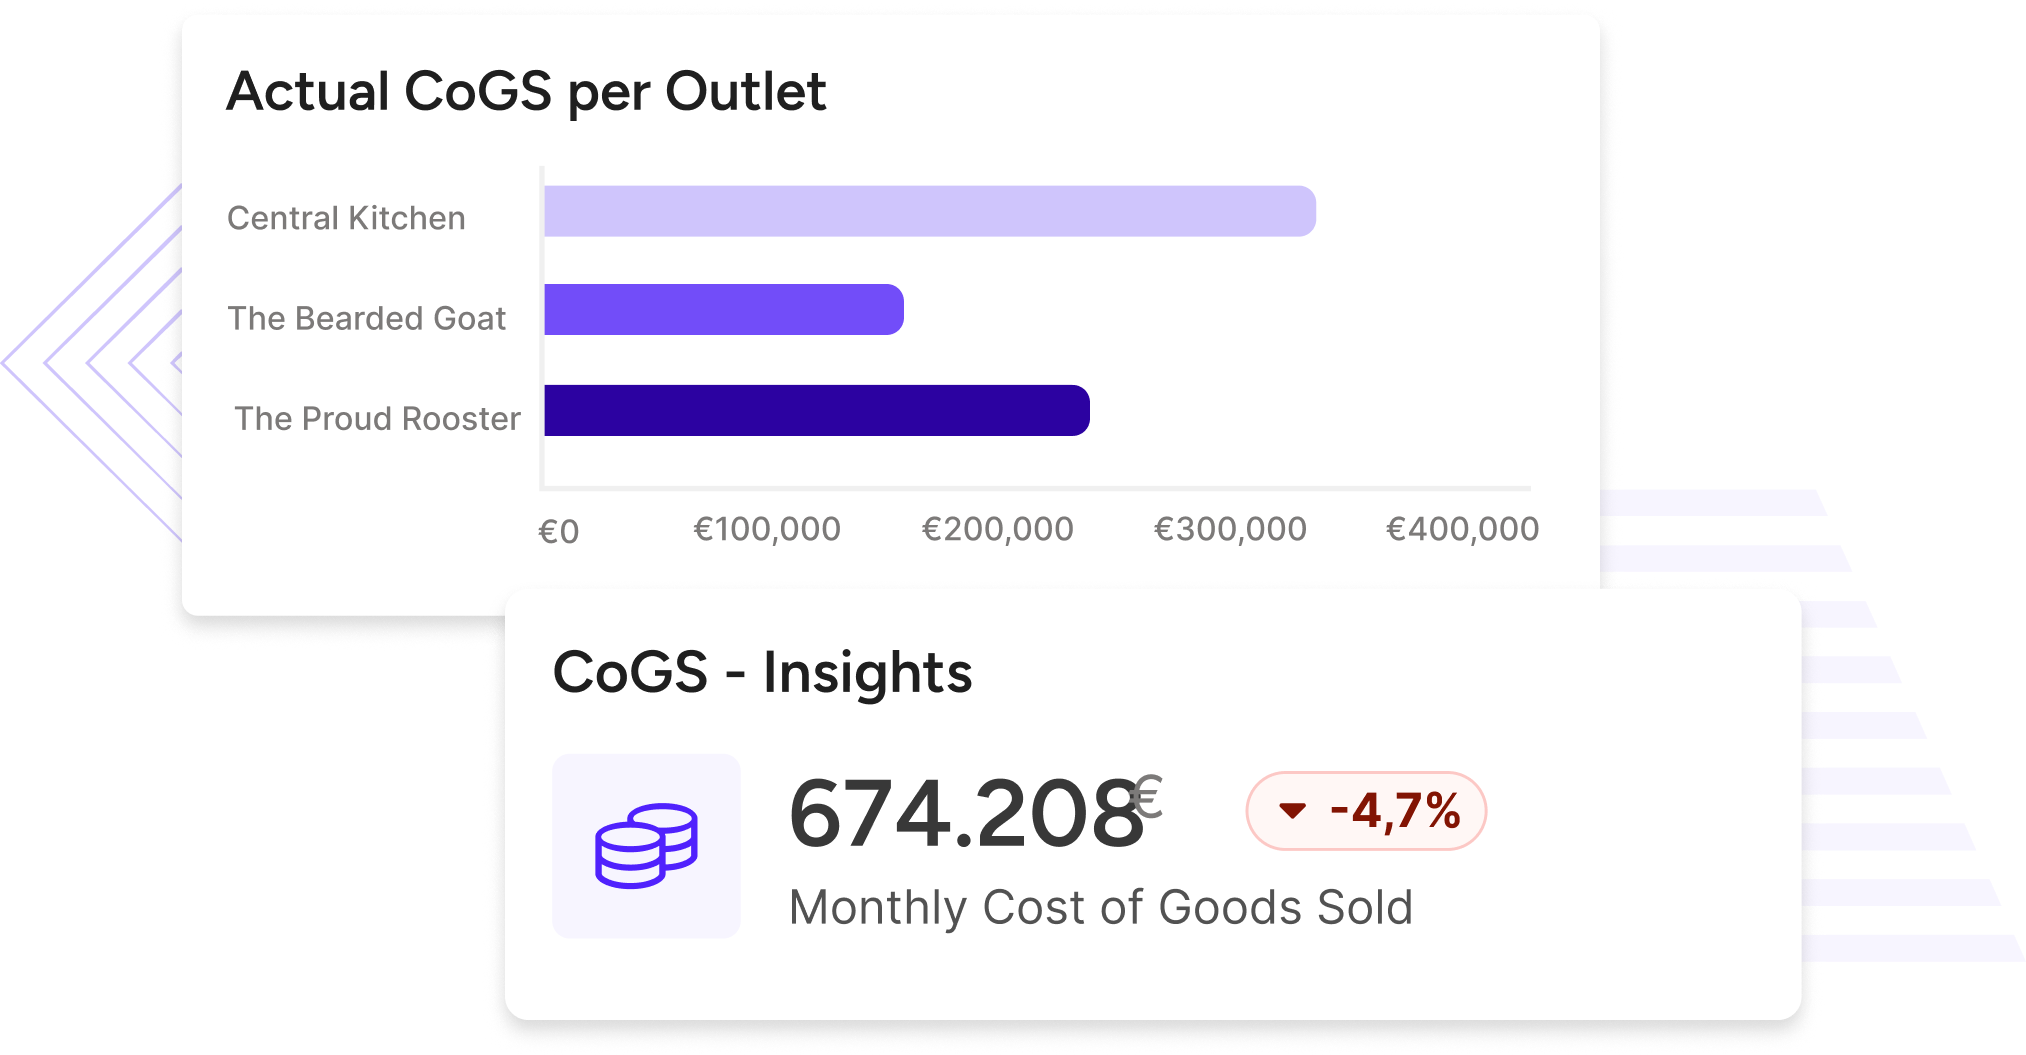
Stay on top of CoGS
Zoom in on cost-of-goods-sold per location to discover vendor & inventory discrepancies that are hurting your bottom line.
Get location-specific F&B insights through Apicbase
Spreadsheet busywork and data ambiguity are slowing down business growth. Restaurant analytics dashboards help you to scale your operations efficiently by reducing your food costs & increasing your profits.
From an HQ standpoint: Apicbase dashboards give us a quick & accurate overview of the goings-on in our restaurants at any moment. Since we’re growing fast, this visibility is essential. Plain & simple.
Jay Greenslade
The Avocado Show
Restaurant analytics software. Keep costs down and quality up