Advise on operational efficiency, customer satisfaction and profitability in the knowledge that all your recommendations are backed by data and analysis.
Centralised Data Management
Say goodbye to the chaos of spreadsheets, overflowing emails, and disjointed data. Apicbase consolidates sales, supply chain, inventory, and menu analytics into one streamlined platform.
Advanced Analytics and Reporting
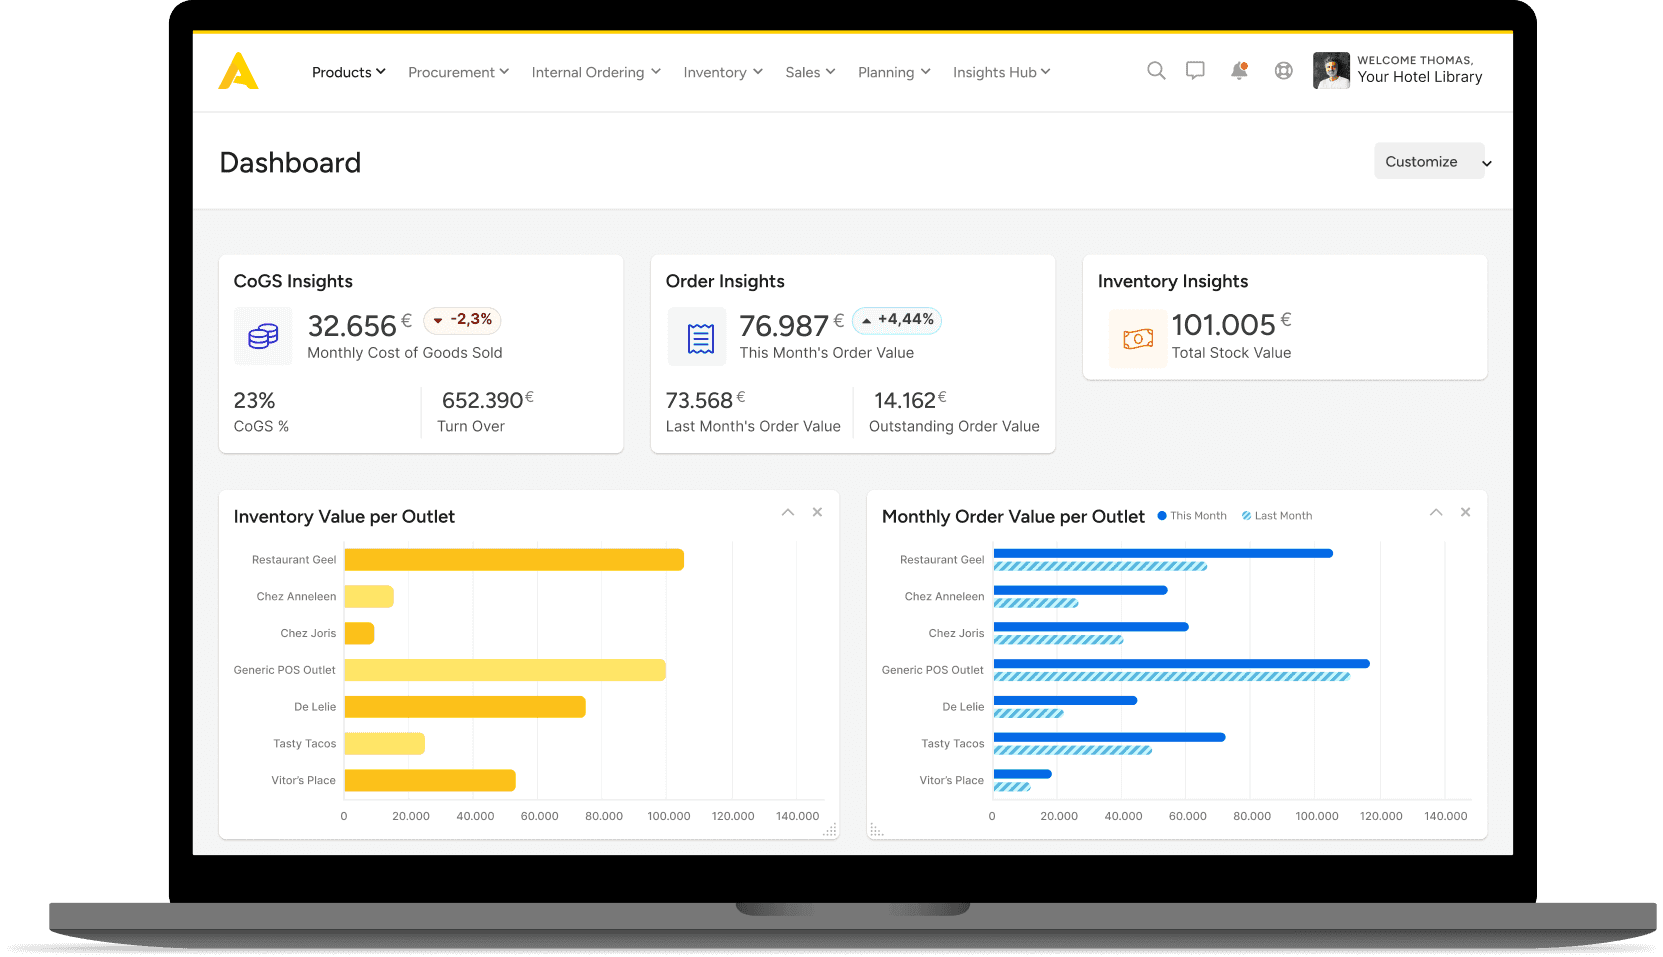
Identify trends, reveal hidden patterns and get actionable insights to drive your restaurants forward. Our dashboards show everything in an instant.
Strategic Decision-Making
Empower your organisation's decision-makers with smart insights for menu development, pricing, and operations, turning in-depth analytics into clear, actionable strategies.
Operational Excellence
Apicbase turns raw data into strategic insights that enhance back-of-house operations, covering purchasing, inventory, and menu engineering.
Boost Restaurant Profitability
Optimise Menus
Track and identify bestsellers and high-profit items over time to inform targeted product development and marketing strategies.
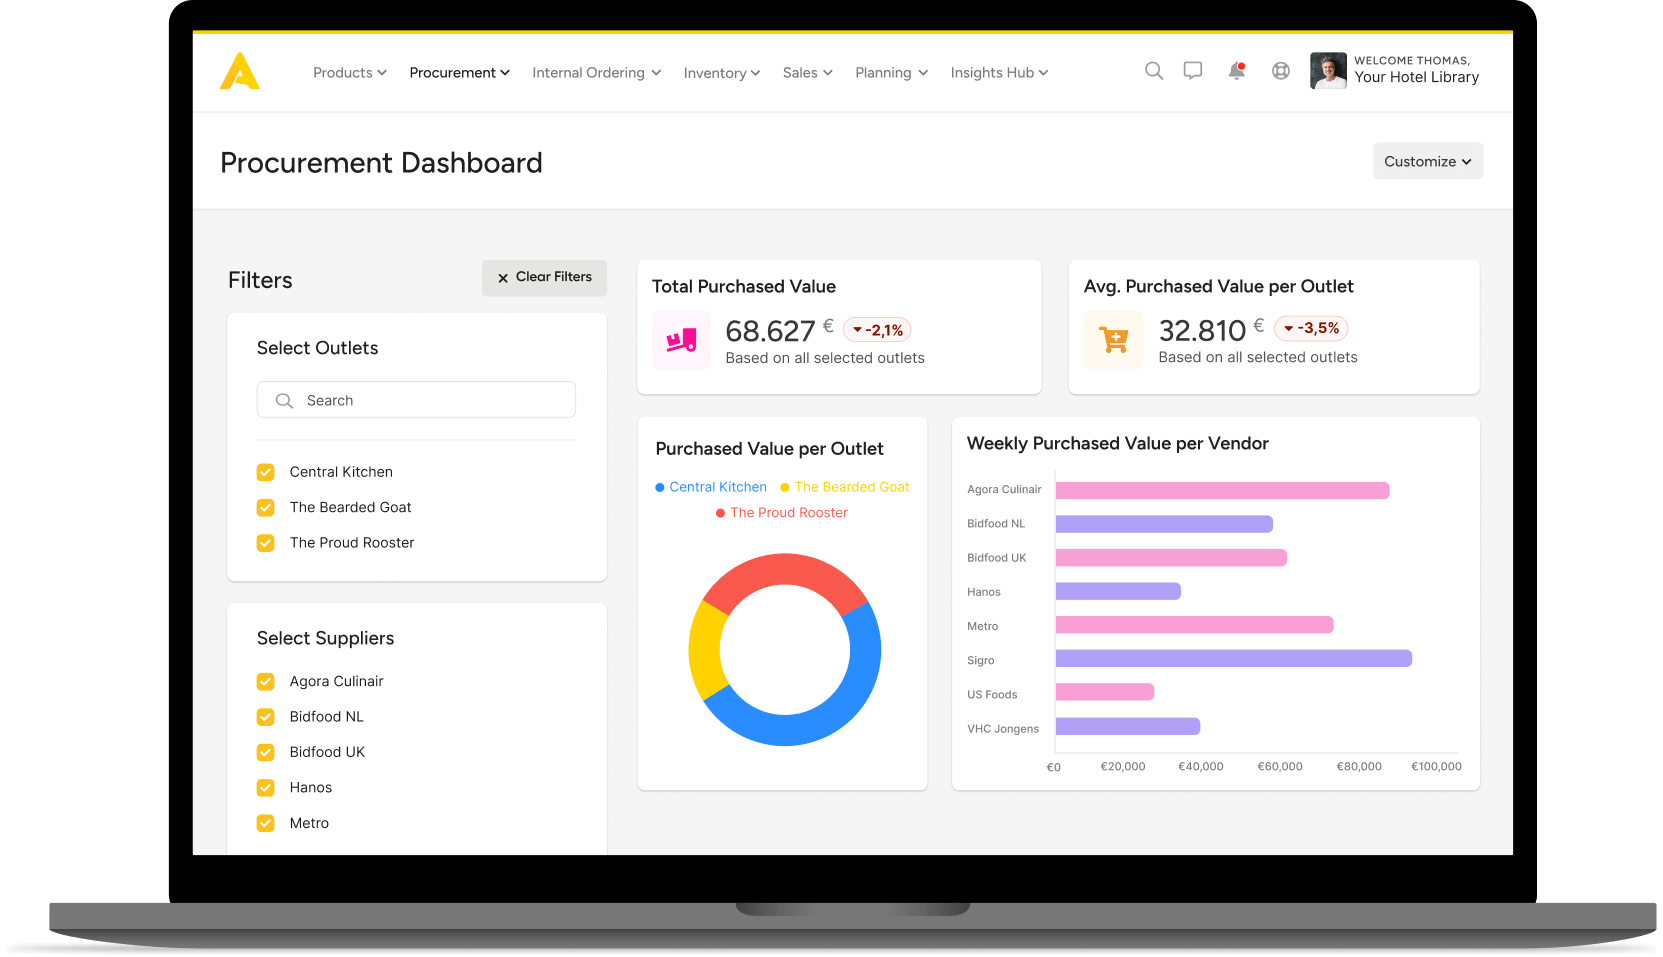
Track Supplier Efficiency
Use our dashboards to track supplier performance, analyse purchasing trends, streamline orders, spot mistakes, and negotiate better prices.
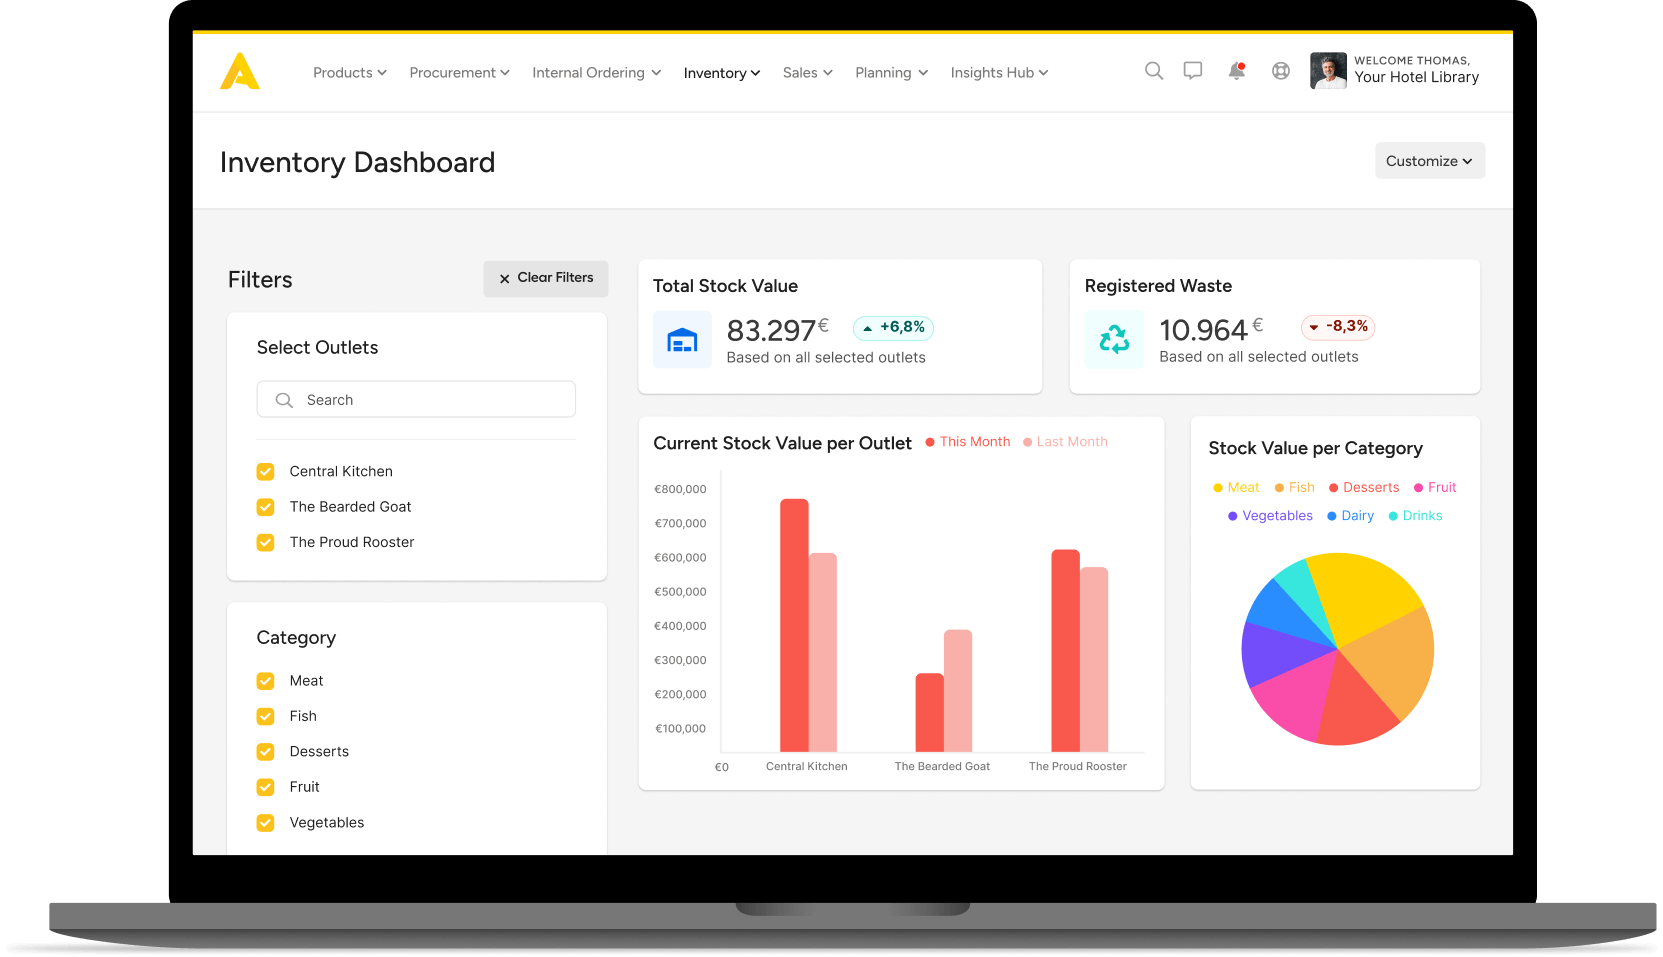
Monitor Outlet Performance
Use real-time data to evaluate each outlet’s efficiency and profitability. Identify trends and areas for improvement to optimise operations and boost revenue.
Discover Apicbase’s Charts and Graphs for Data Analysts
Apicbase turns complex data into clear graphs and charts, making it easy to spot trends and anomalies. Drill down into details without the hassle of manual data compilation.
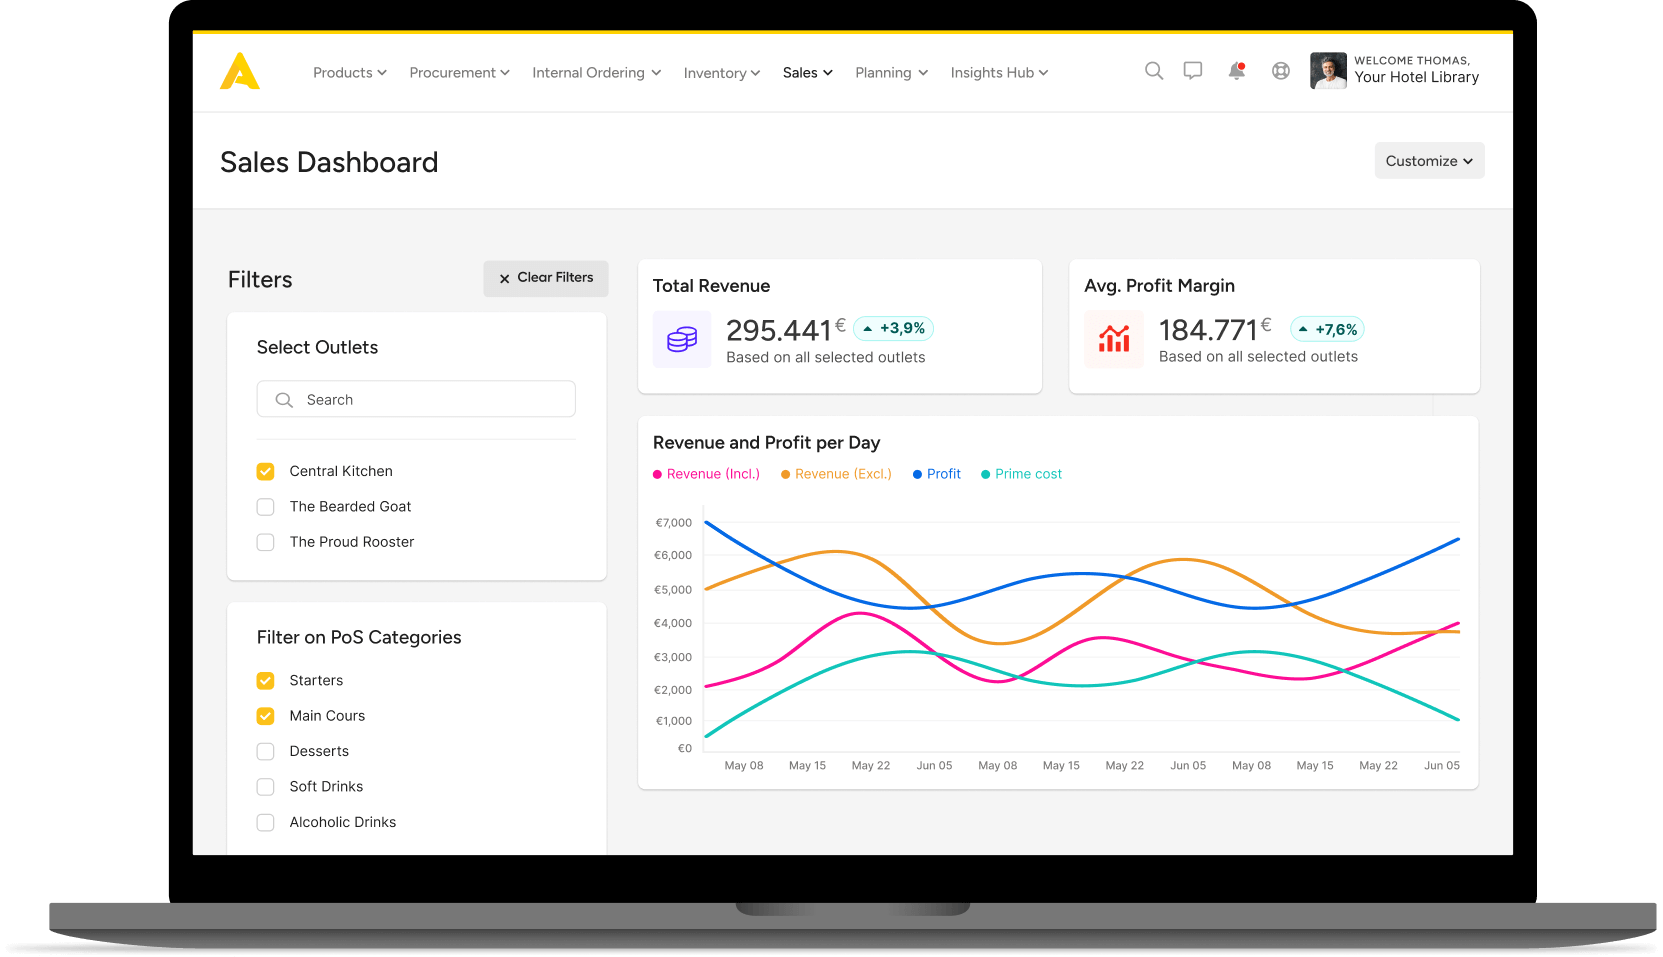
Sales Insights
Monitor revenue and profits by outlet, menu category, and individual item, observing their progression over time. With this clarity, enhancing profitability becomes simpler than ever.
Compare actual with theoretical costs of goods sold and track discrepancies. Analyse the data deeply to provide informed recommendations to narrow variance.
Track supplier performance and pricing patterns. Review order histories and conduct cost analyses in a few clicks. Use these insights to mitigate risks, negotiate favourable terms, and forecast budgets accurately.
With Apicbase, you can slice and dice stock data in countless ways. You’ll uncover the items that drive food costs and be able to guide procurement and menu development in your company.
I love the stock count variance reports. They show, in detail, what happens to a product from the moment it enters the company until it’s served to the customer.