Even when recipes are standardised across locations, food cost can spiral. And when it does, the P&L won’t tell you why.
That’s what happened at this 24-location pizza chain. Sales were up. Quality consistent. No complaints. On the surface, everything looked fine.
But underneath, something was off, and no one could see it.
That changed when they started using Apicbase.
For the first time, they had a clear view of their margins. And something didn’t add up. So, they dug into the numbers from the last quarter.
What they found was shocking:
- A €280,000 gap between actual and theoretical food cost
- €91,000 of that loss came from just one ingredient
No one had noticed it before. They had no visibility into what was really being used. Who knows how long it had been going on?
Here’s how they found the leak.
Step 1: Spot the Issue
Every menu item you sell has a cost. That’s normal. You buy ingredients to make food — simple.
In a perfect world, your ingredient usage matches what you sell. But if you’re using more than you’re selling, margin is quietly leaking out.
That’s what the ops team saw when they opened their CoGS dashboard. They were using more than they were selling.
A lot more.
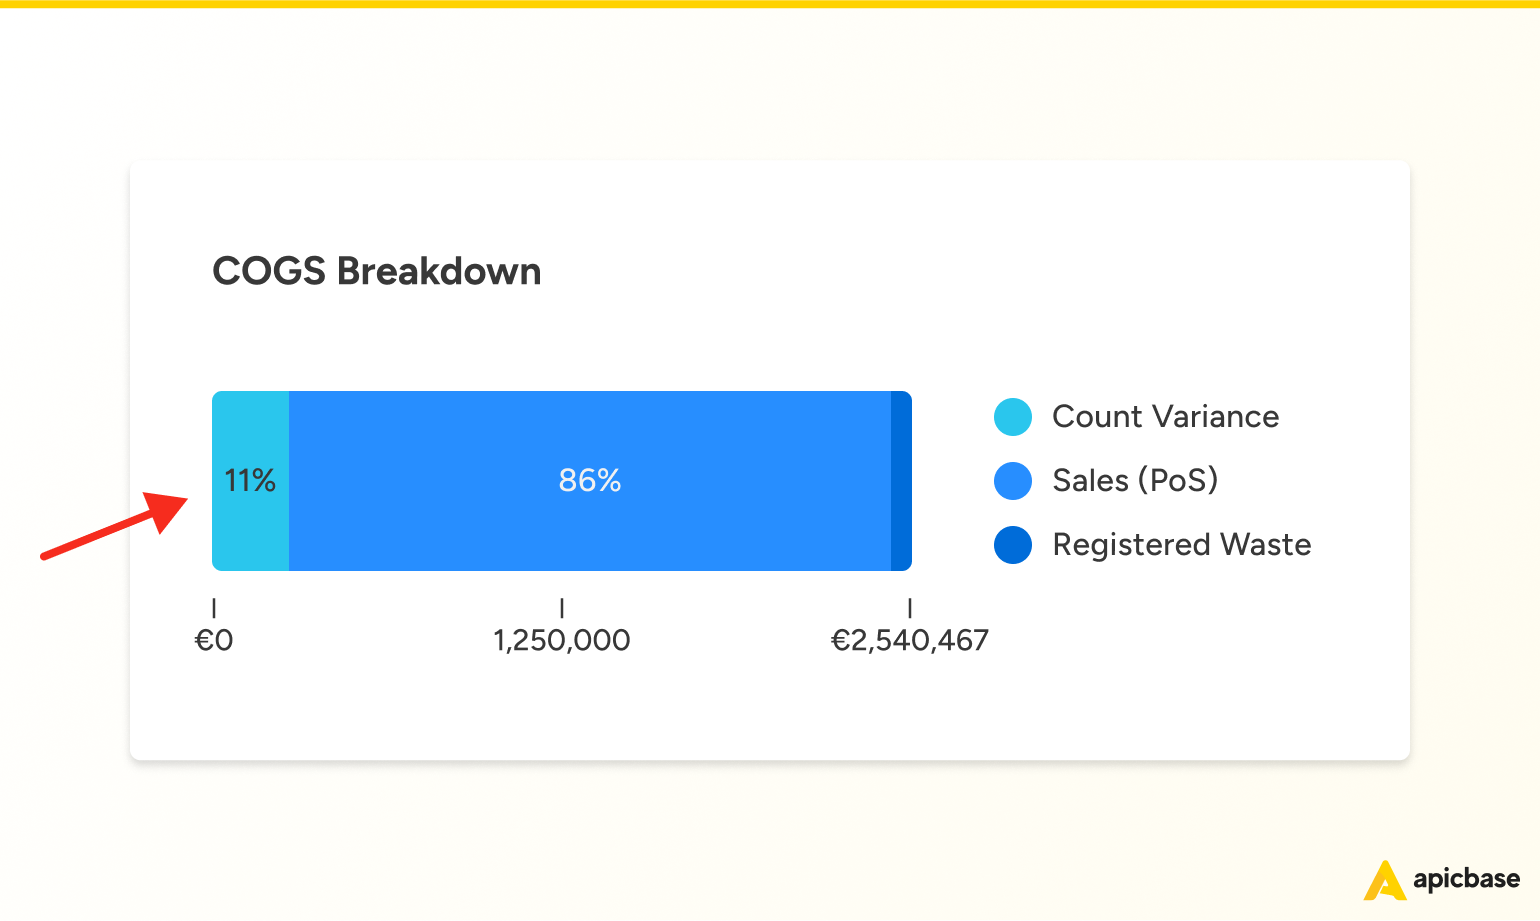
Here’s what the breakdown means:
- Sales (POS) – 86%
This is the portion of their food spend that directly links to what was sold. Best case scenario, this is 100%.
- Waste – 3%
This includes anything manually written off in Apicbase. For example, a bag of spoiled salami. No sale, but a legitimate loss.
- Count Variance – 11%
This is where things get murky. It’s the part of their food cost that has no explanation. No sale. No waste. Just… gone.
When the team understood that 11% of their food spend had no explanation, they knew they had a serious problem.
What is Count Variance?
Count variance is the difference between what Apicbase expects to find in stock — based on your sales, deliveries, and recipes — and what’s actually there when you do the count.
In other words, it’s the gap between your theoretical stock and your actual stock, what you’re supposed to have, and what you really have.
For example:
- Apicbase expects to see 5 bags of grated mozzarella.
- But when a stock count is done, only 1 bag is there.
- That’s 4 bags unaccounted for — a variance of 4.
And that variance has a cost.
Those bags were bought, but not sold, so they quietly eat into your margin. Multiply that across hundreds of ingredients and dozens of locations, and invisible losses add up fast.
Ideally, your Count Variance is zero, meaning every euro you spent is backed by a sale or a recorded loss.
The smaller your variance, the bigger your margins.
Step 2: Quantify the Damage
Seeing 11% of your food cost disappear without explanation feels bad.
But how bad is it really?
Time to do the maths.
Here’s what the team learned when they looked at the numbers for Q1:
- Total COGS: €2,540,467
- Explained by sales (86%): €2,184,801.62
- Explained by waste (3%): €76,214.01
- Unexplained (11%): €279,451.37
So nearly €280,000 vanished.
It’s just… gone.
And here’s the thing: if no one had caught it, this would’ve kept happening.
Quarter after quarter. Site after site.
What causes Count Variance?
Now that we’ve seen the size of the hole, the natural next question is: Where’s the money going?
Common causes of count variance include:
- Overportioning
- Unregistered waste
- Stock not being counted correctly
- Recipes not being followed
- Or, most often, a mix of all of the above
You don’t need to guess. Apicbase shows you exactly where to look next.
Step 3: Zero In on Problem Locations
The team needed to figure out where the losses were happening.
So, they opened the Count Variance dashboard in Apicbase and grouped the data by location.
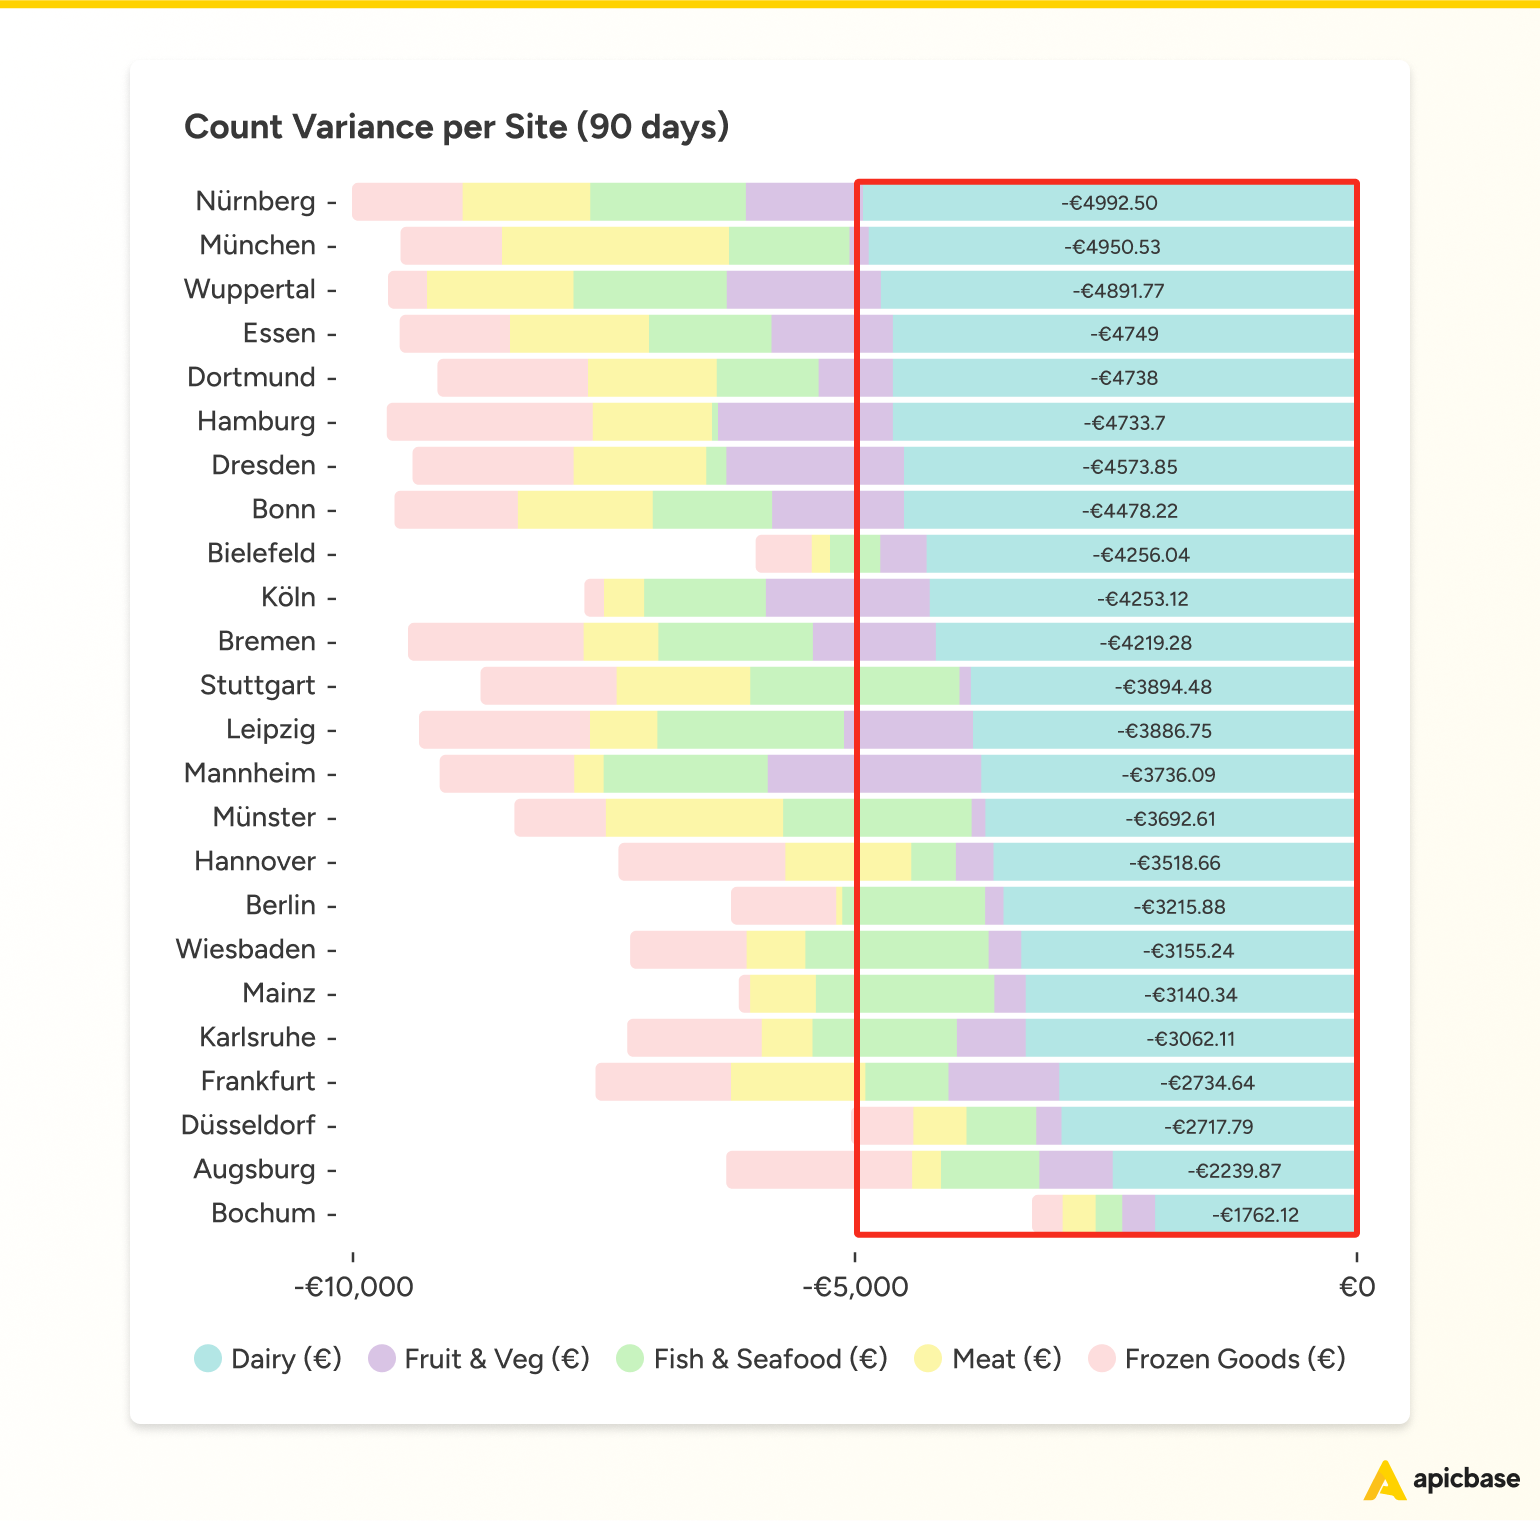
Instead of guessing or emailing around for answers, the ops team could instantly see which sites were bleeding margin and where to focus next.
One look at the chart, and two things stood out:
- It wasn’t just a few rogue restaurants. The issue was widespread, happening across nearly every site.
- Dairy was a major problem, driving a huge part of the loss.
The team had pinpointed the worst-performing locations.
The next question was clear: which ingredients were responsible?
Step 4: Drill Down to the Ingredients
Drilling down into the data, the team identified the top ingredients contributing to this overall variance. In many systems, that would’ve meant hours of consolidating data in spreadsheets.
But in Apicbase, they just scrolled to the next chart.
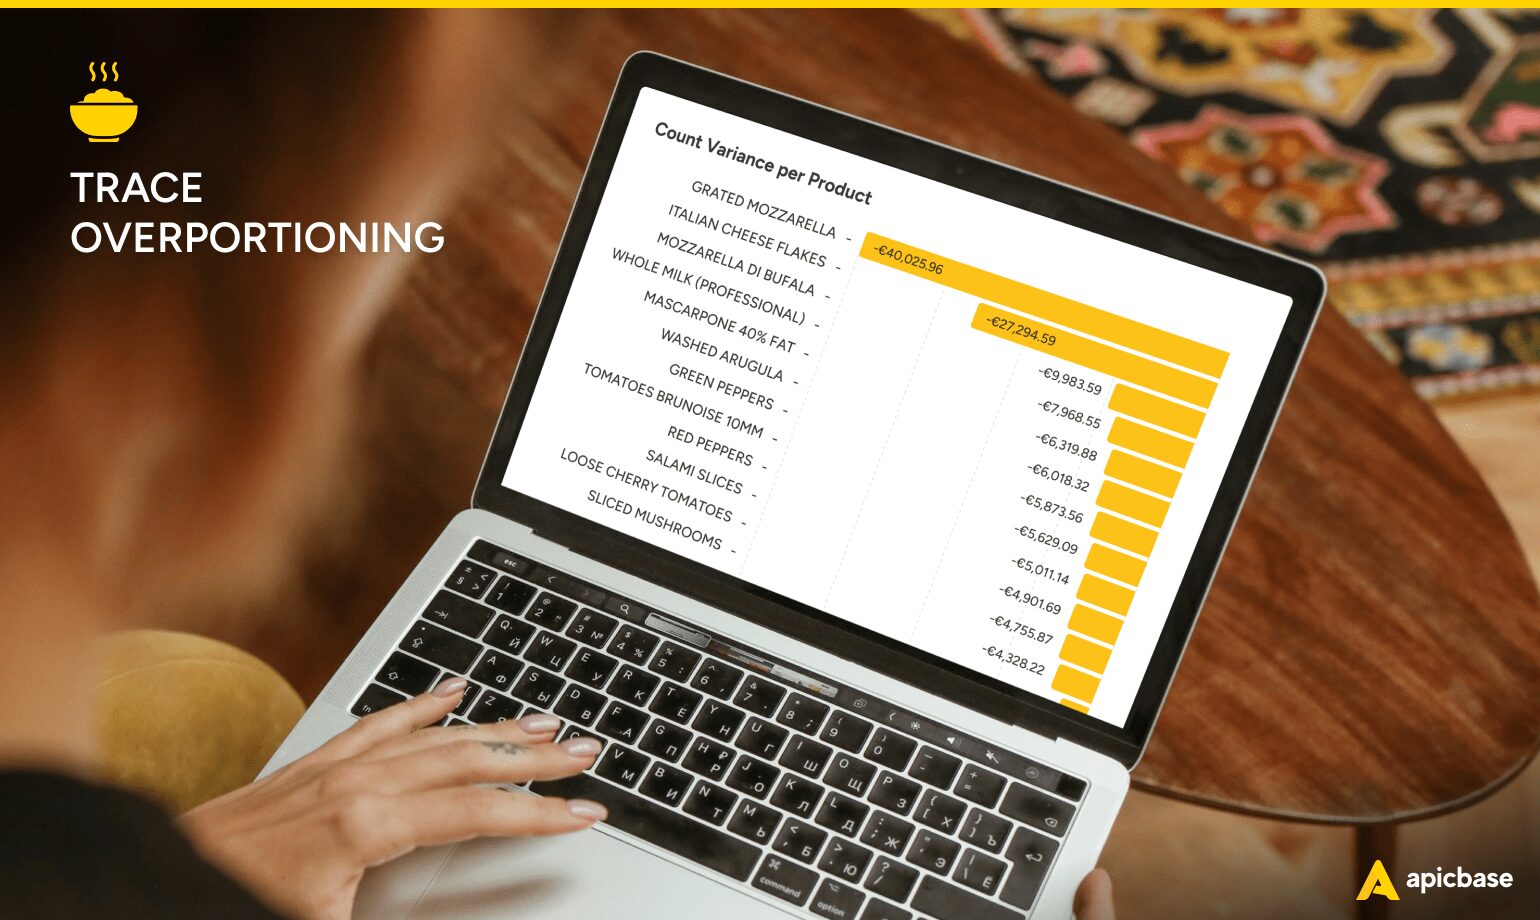
The Count Variance dashboard shows the top 15 ingredients causing the most unexplained cost.
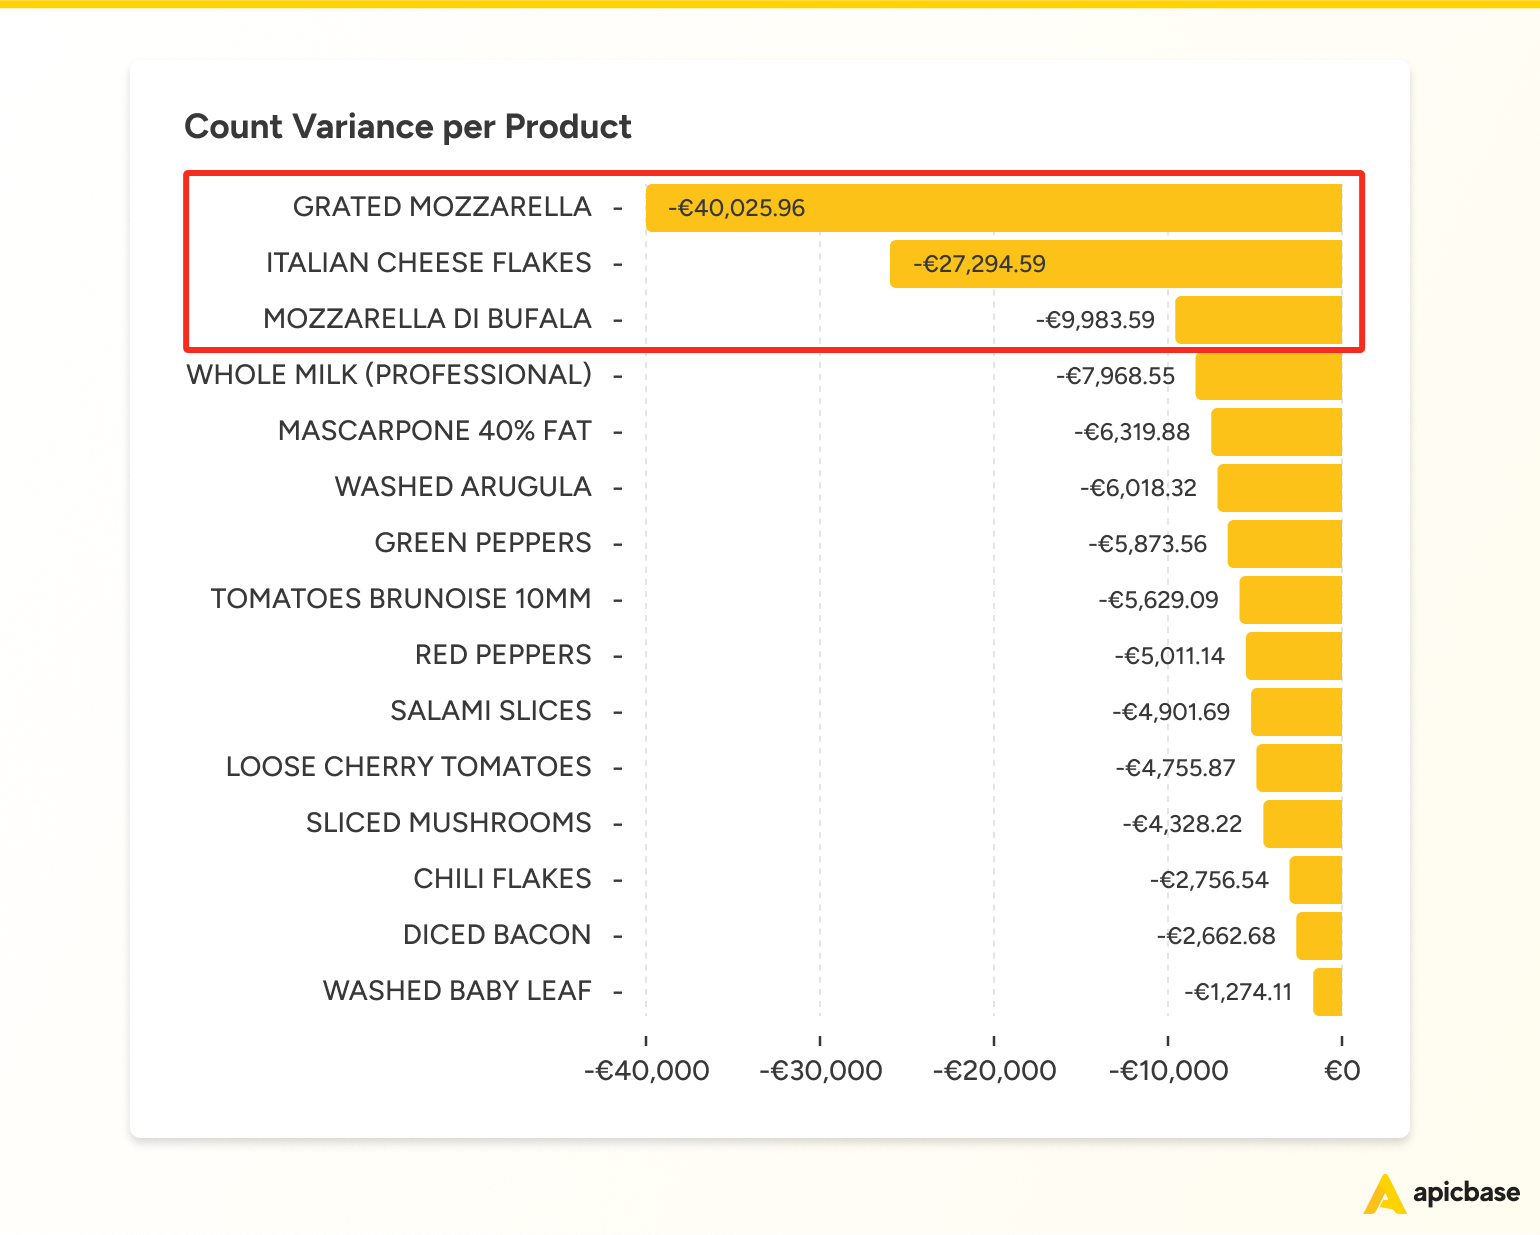
For the pizza chain, the top three were all cheese:
- Grated mozzarella: €40,025.96
- Italian cheese flakes: €27,294.59
- Mozzarella di bufala: €9,983.59
From just those three ingredients, they had lost over €77,000 in one quarter. Widen the lens to the top five ingredients, all dairy, and the total hits €91,593.
Why didn’t anyone notice?
It’s a pizza chain; cheese is everywhere. These ingredients are used constantly, stocked in bulk, and reordered without question. The fridge is never out of mozzarella, so it feels like stock is under control.
They just kept ordering, and the leak stayed hidden.
Until now.
Step 5: Is It a Recipe or a Kitchen Issue?
Now that they knew what was causing the loss — cheese, the big question was: Why?
- Grated mozzarella isn’t likely to be stolen.
- It doesn’t spoil easily, either. It’s used all day, every day.
That left only one probable cause: overportioning.
But where was it coming from?
- Was someone in the kitchen being too generous?
- Or was the recipe itself off?
To find out, the ops team zoomed in on the location with the highest variance: Nürnberg. Then, they checked how that variance changed month by month.
Surprisingly, there was almost no change at all.
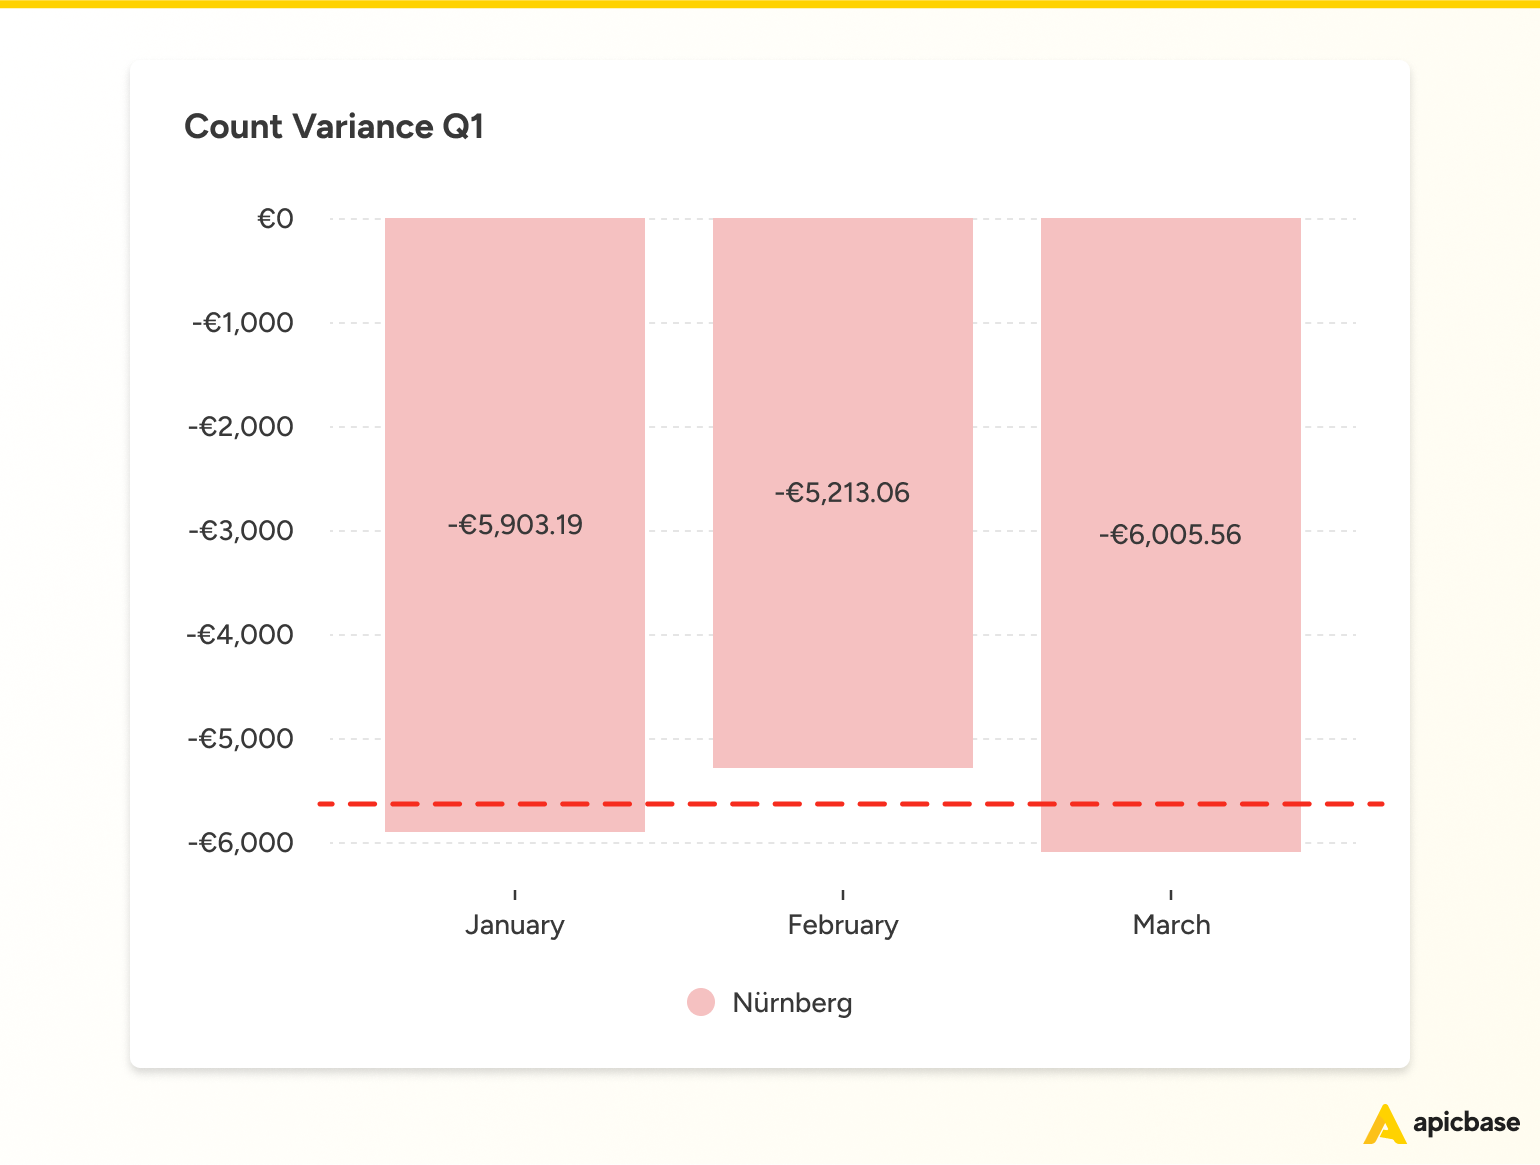
That’s a clear sign the problem wasn’t random but built into the system.
If it had been a one-off kitchen mistake, you’d expect spikes or dips. But this was consistent. Predictable. Ongoing.
Most likely, the recipe itself wasn’t accurate.
- Maybe the portion size didn’t reflect what staff actually used, or
- Maybe the instructions were too vague.
There was only one way to be sure: go see it in action.
Step 6: Seeing It with Their Own Eyes
Apicbase had shown them where the variance was and which items were affected.
But to understand why, the team needed to see it with their own eyes.
So that’s what the ops team did. They visited the sites with the biggest losses and watched how the pizzas were being made — step by step.
They compared what was happening on the line with what was written in the recipe. They looked at how ingredients were portioned, how the team worked during prep, and whether standard tools were being used.
That’s when the issue revealed itself.
The recipe specified 100 g of mozzarella. But in practice, no one was measuring.
Some cooks added a bit more. Others grabbed a full handful. They weren’t being careless. They were working fast and doing what felt right. But without tools to guide them, those small overages added up fast.
And that’s how an everyday kitchen habit quietly drained over €90,000 in just one quarter.
The fix
Once they saw what was happening on the line, the solution became clear: help the team follow the recipe more consistently.
Here’s what they did:
- Added standard scoops to every kitchen
- Retrained the team on the portioning standard
From there, they worked their way down the count variance list — ingredient by ingredient, fix by fix.
Each update plugged a part of the original €279,451 leak, redirecting margin back to the bottom line.
To Conclude: It Was Never About the Cheese
Sure, cheese was the ingredient that showed up on the dashboard.
But the real issue wasn’t mozzarella, it was a lack of visibility.
- No portioning tools.
- No feedback loop for the team.
- No way to see the impact of small, everyday habits.
And without that clarity, no one realised how much margin was being lost.
The fix wasn’t complicated.
But knowing what to fix, and where, made all the difference.
What This Team Got Right
Of course, this kind of margin recovery doesn’t happen by accident. It requires the right habits, tools and visibility across the whole operation.
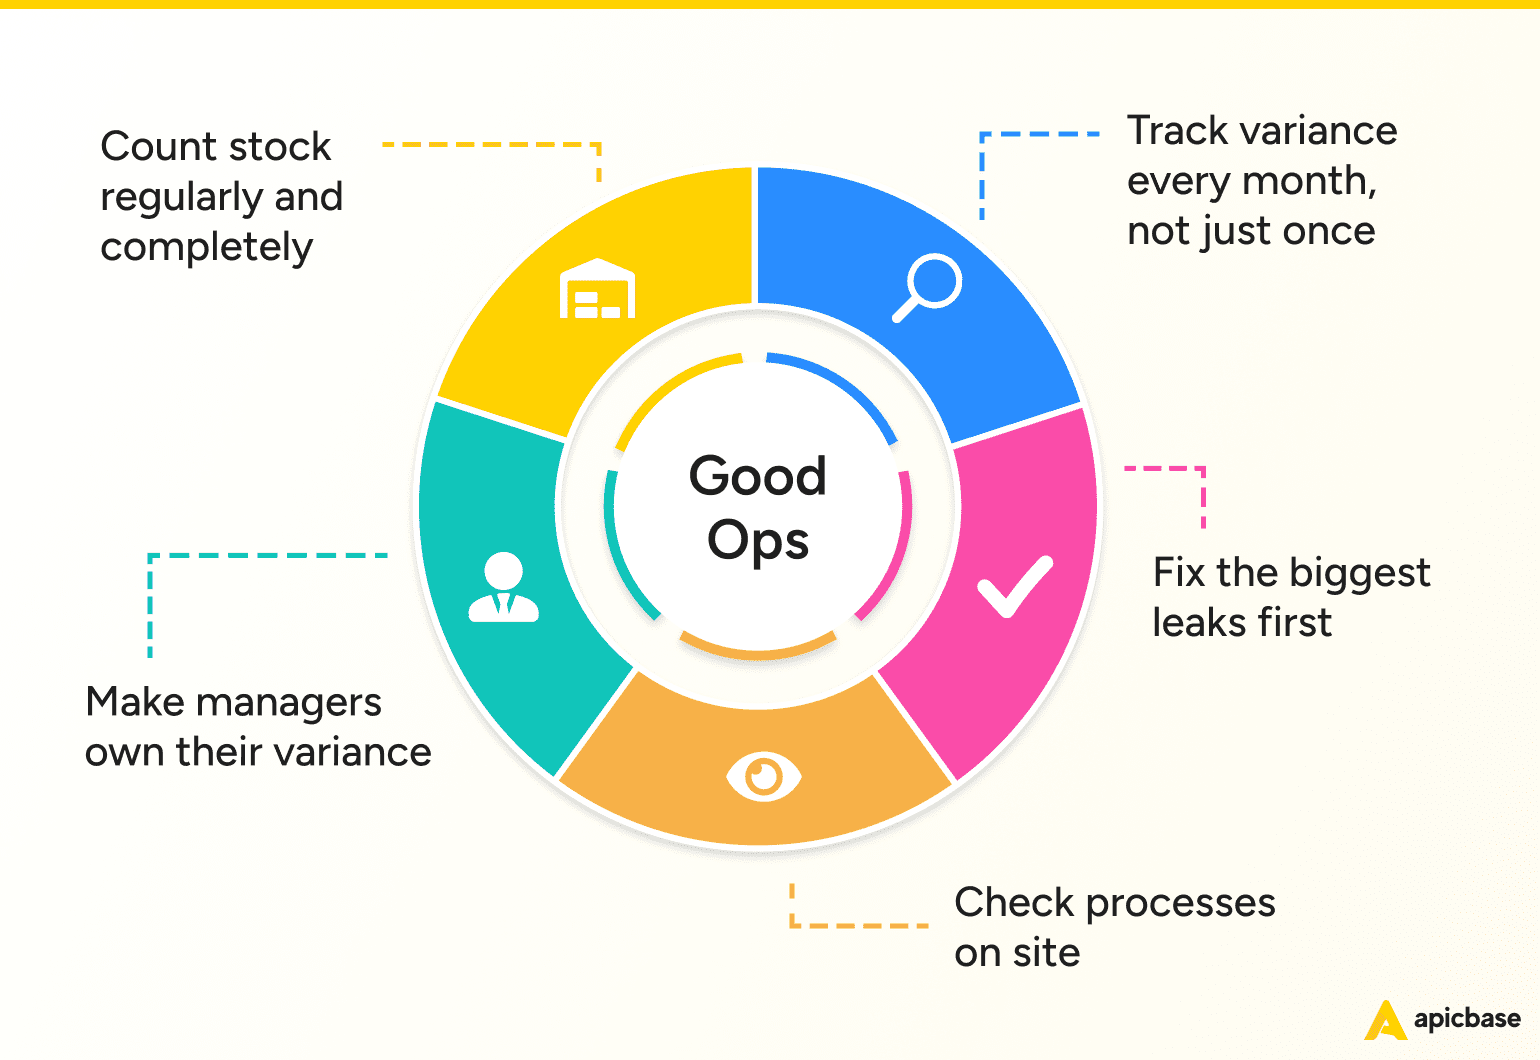
Here’s what helped the ops team catch the issue fast, fix it at scale, and lock in the results:
1. They counted stock regularly, and completely.
Every location counted all items at least once a month. No shortcuts. That gave them the data they needed to see where things were going off track.
2. They didn’t just look at variance once.
They tracked it over time. One data point is noise. Multiple data points show patterns.
3. They started with the biggest leaks.
Cheese stood out, so they fixed it first. No endless analysis, no perfectionism — just action. It got momentum going.
4. They visited kitchens when the data didn’t explain everything.
When something didn’t add up, they didn’t guess; they went in, watched prep, asked questions. That’s how they spotted the vague recipe line.
5. They gave managers visibility, and ownership followed.
When restaurant teams could see their own numbers and track progress, they took action. Seeing the results ⎯ less variance and better margins ⎯ kept them engaged.

You can’t fix what you can’t see.
Apicbase gives you the clarity to catch margin leaks before they drain your bottom line.