Multi-outlet restaurant operations generate a ton of data every day. As an owner or an operations manager, it’s your job to use that data to grow the bottom line.
Easier said than done, right?
When you take all that data — all those reports — into account, piecing together insights becomes as challenging as assembling the world’s largest monochromatic jigsaw. It can be done, yes. But those insights will be outdated by the time you’ve crunched the numbers.
What operators like you desperately need is a way to take all that data and turn it into a solid decision-making roadmap with the snap of a finger.
That’s where restaurant analytics come in.
In a recent post, I talked about the difference between restaurant reporting and analytics. In this post, I drill deeper and show examples of restaurant analytics insights that help you stay on top of the goings-on in your operation. Insights that are actionable and up-to-date. And that will help you add sales on the front end… and cut costs in the back-of-house.
They’re divided into four categories:
- Inventory & purchasing insights
- Restaurant sales insights
- Menu & menu engineering
- Employee & labour insights
Let’s look at how you can use these to streamline and grow your F&B empire.
Inventory & Purchasing Insights
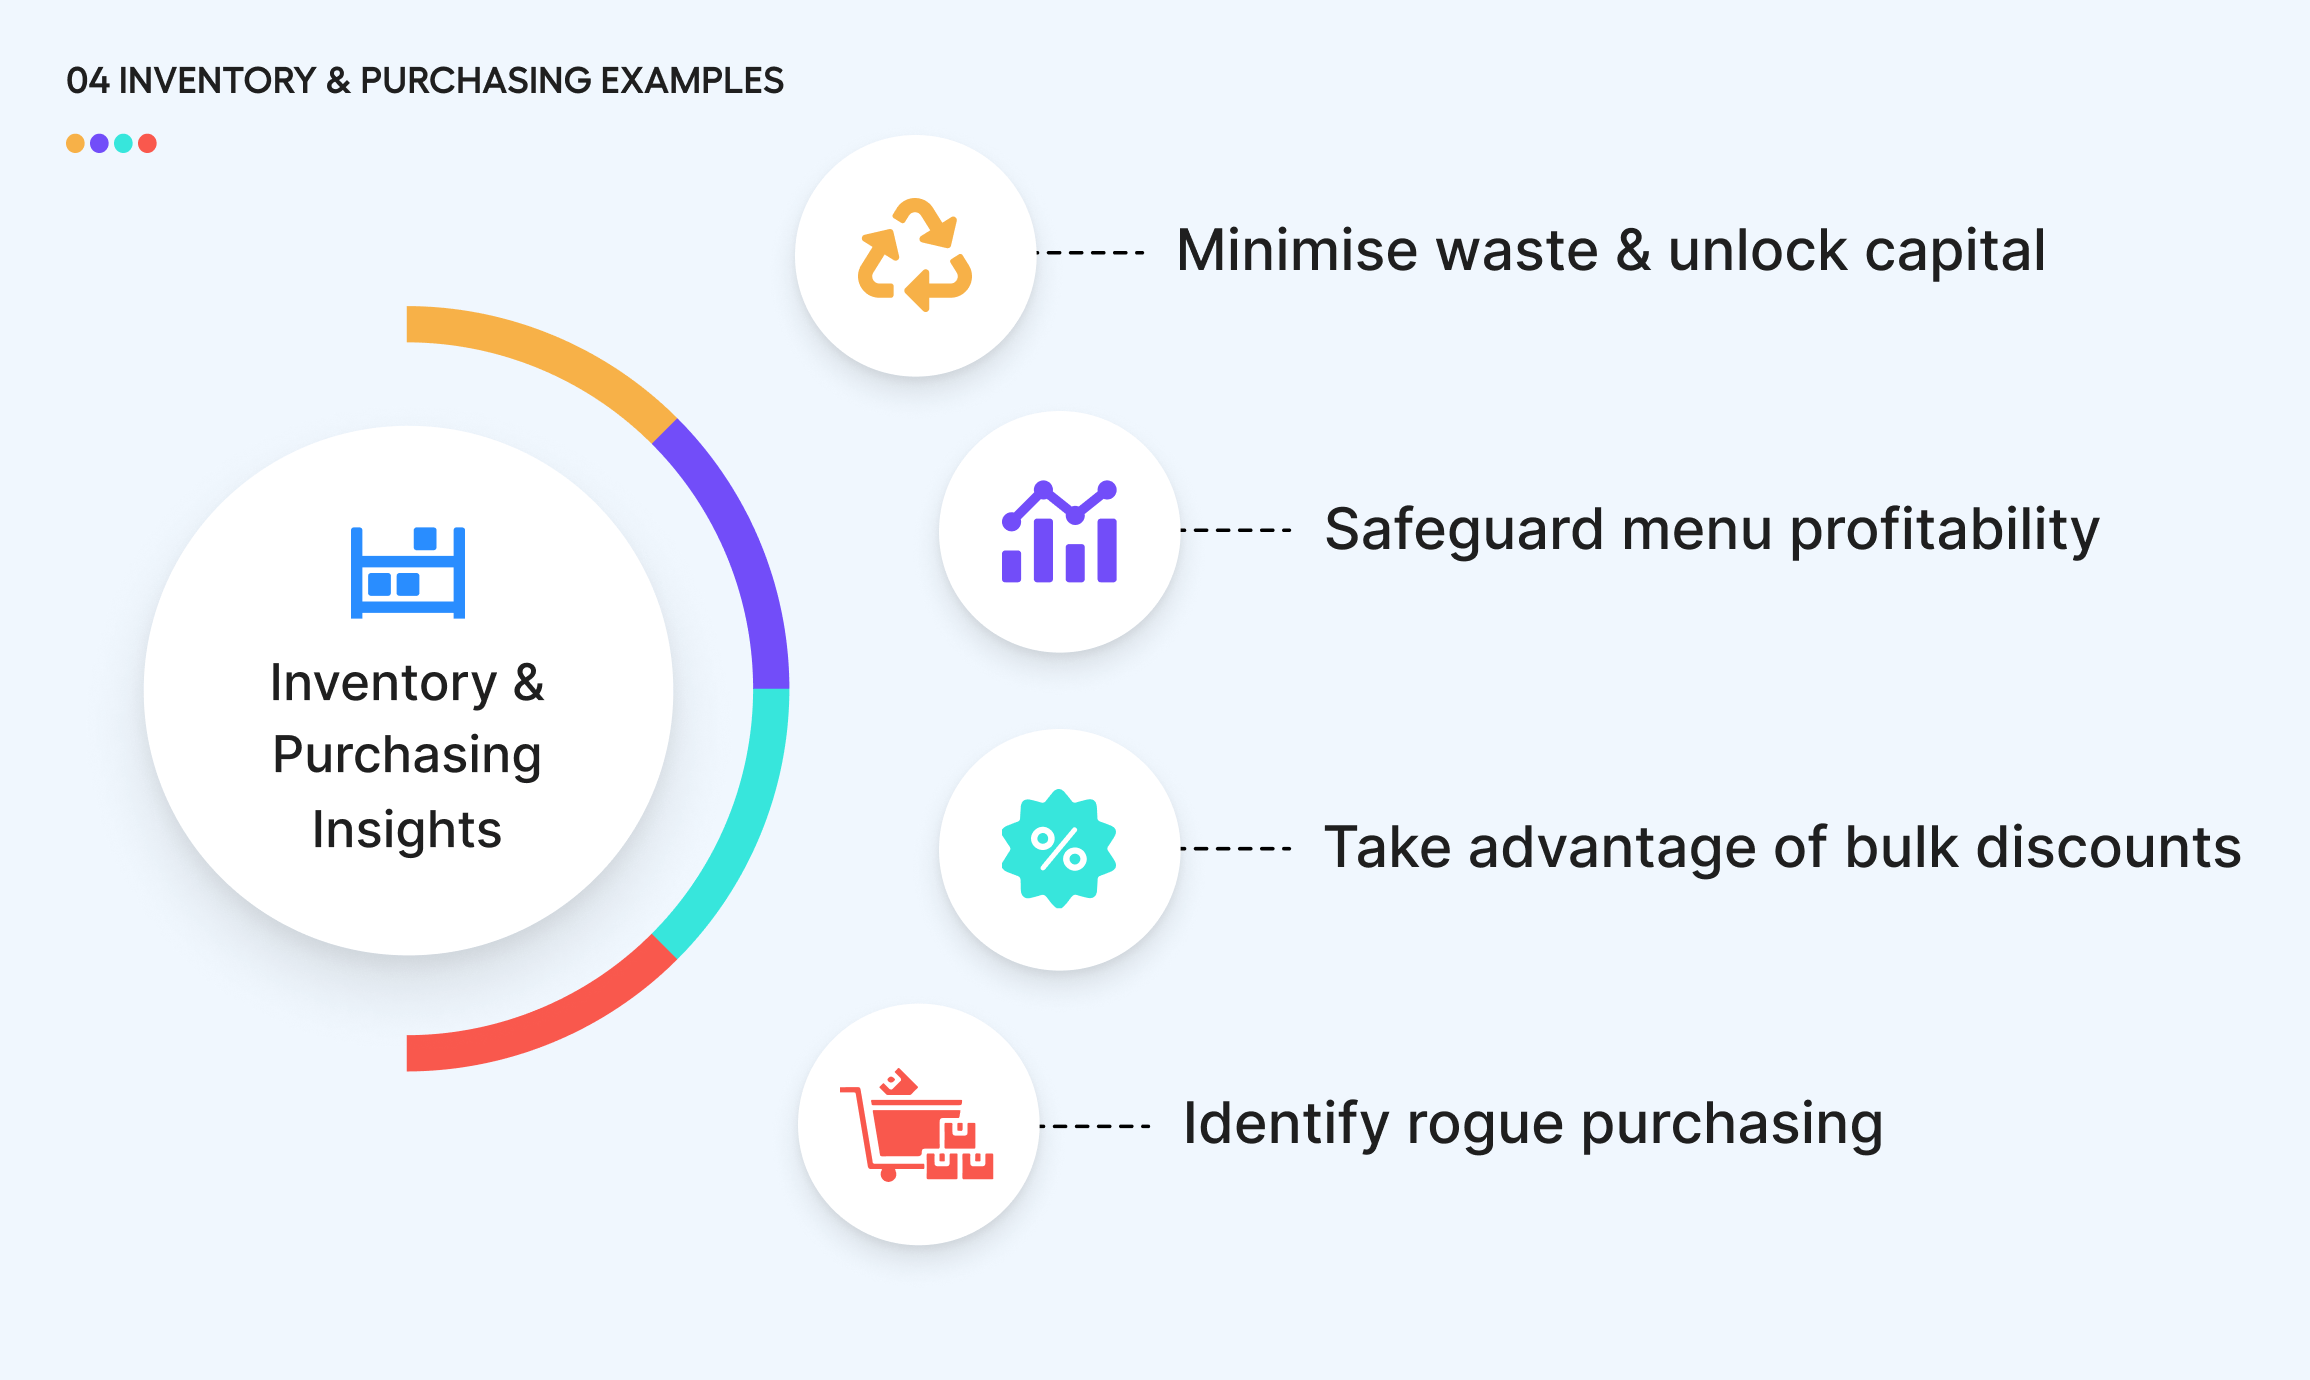
#1 Track actual stock numbers to minimise waste & unlock capital
Tracking actual stock numbers (keeping stock variance close to zero) helps you identify and eliminate waste generators, such as overstocking, poor storage practices, overplating, pilferage, and similar.
The analytics dashboard lets you monitor variance on an operational and outlet level. It also uncovers hidden costs that operations managers often forget to double-check. For example, capital that’s locked in unnecessary stock such as cleaning items, chemicals, and utensils. This gives you an opportunity to prevent unnecessary stockpiling, so you can use the money for wages and financing growth opportunities.
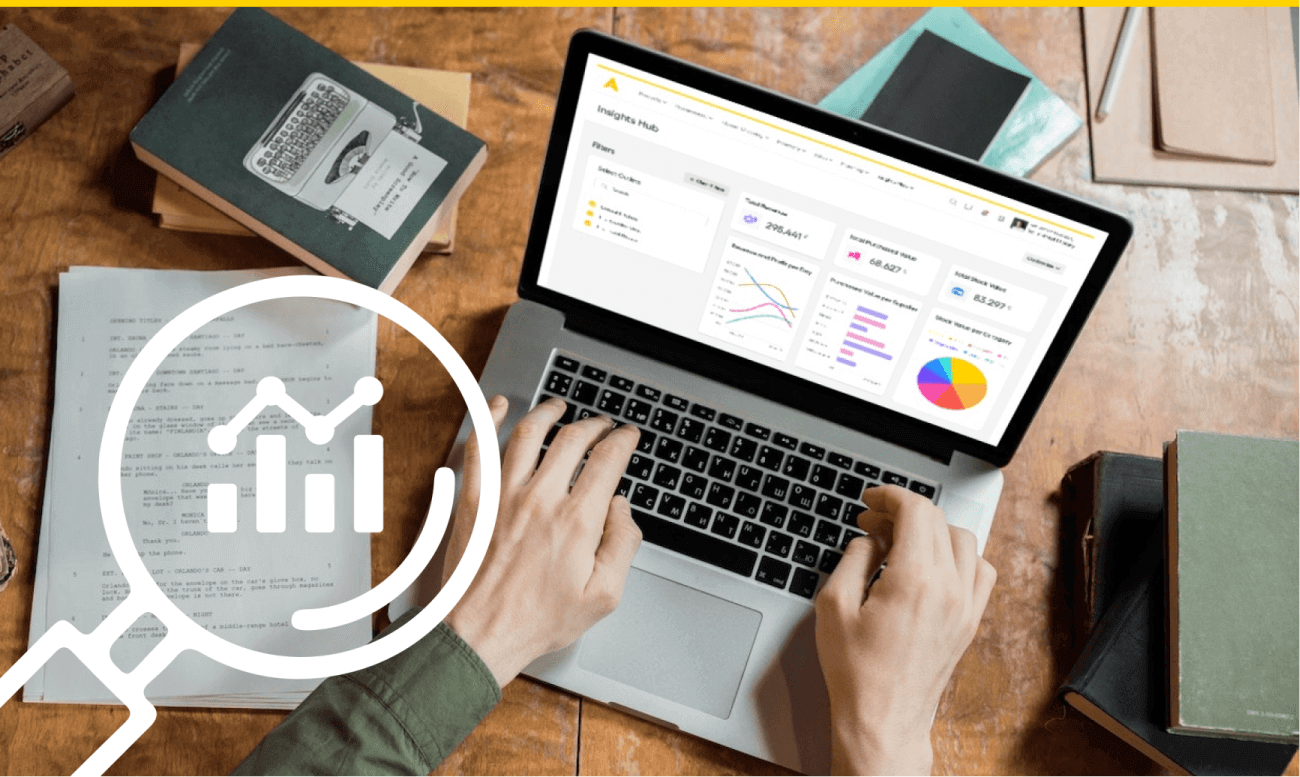
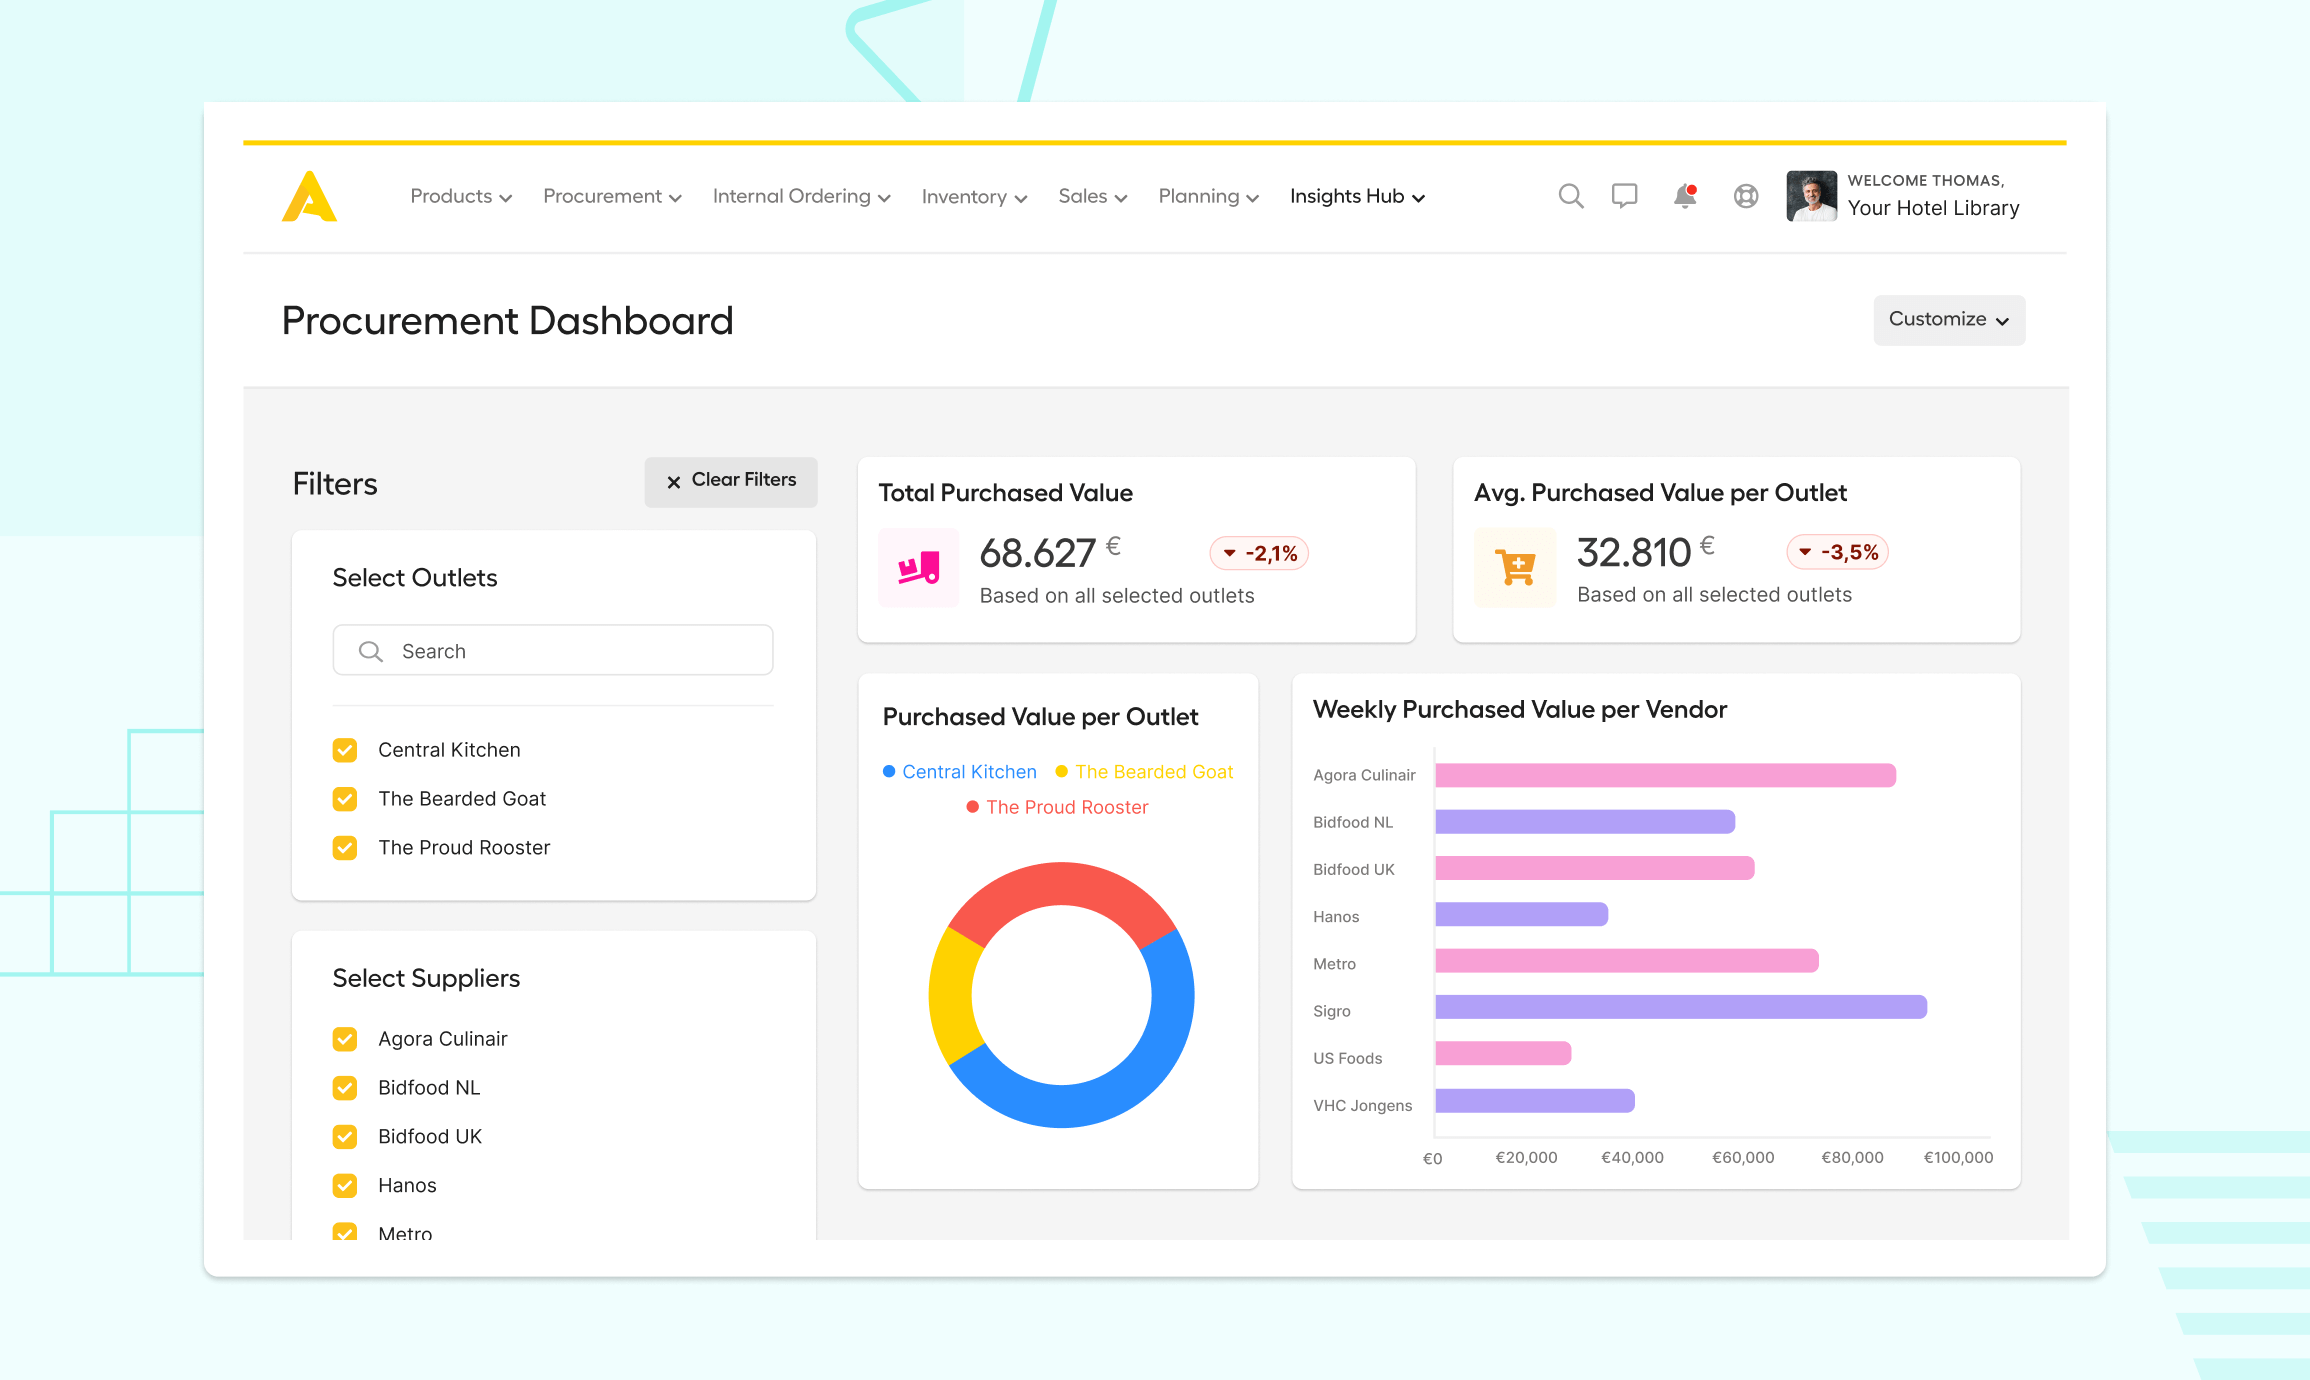
Get location-specific F&B insights through Apicbase
Spreadsheet busywork and data ambiguity impede business growth. Restaurant analytics dashboards help you scale your operations, reduce food costs, and increase profits.
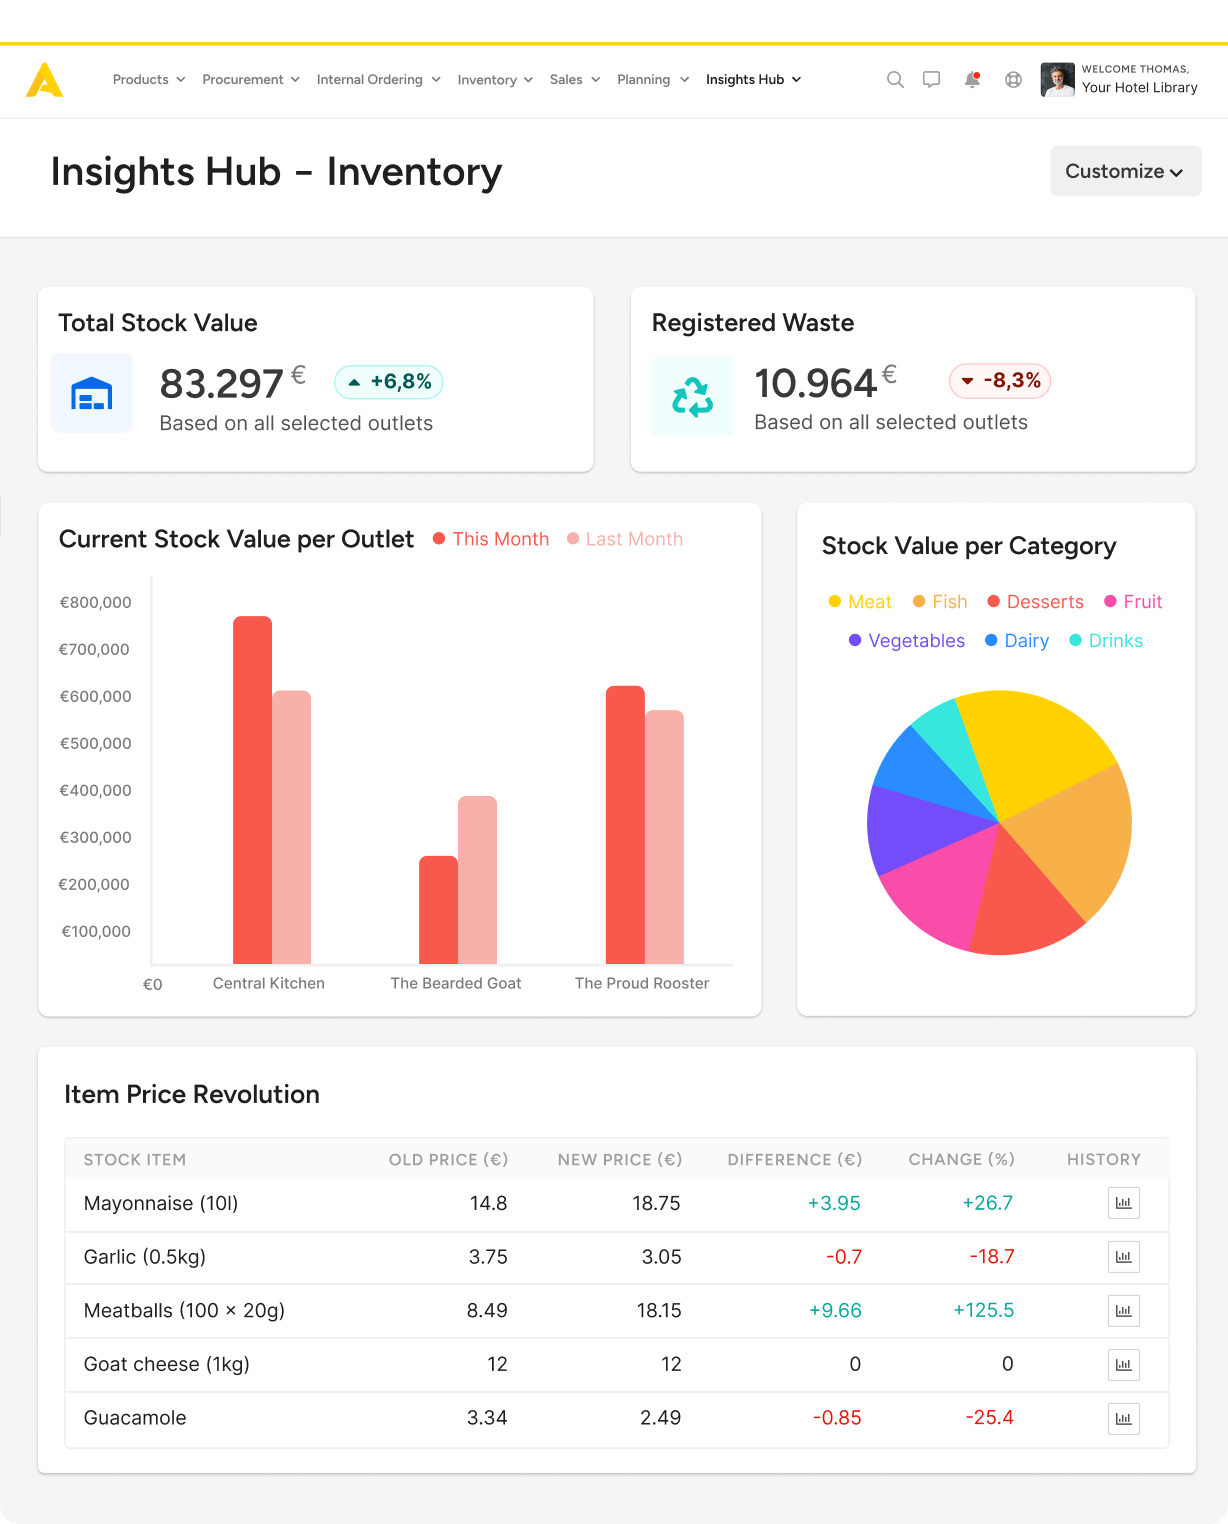
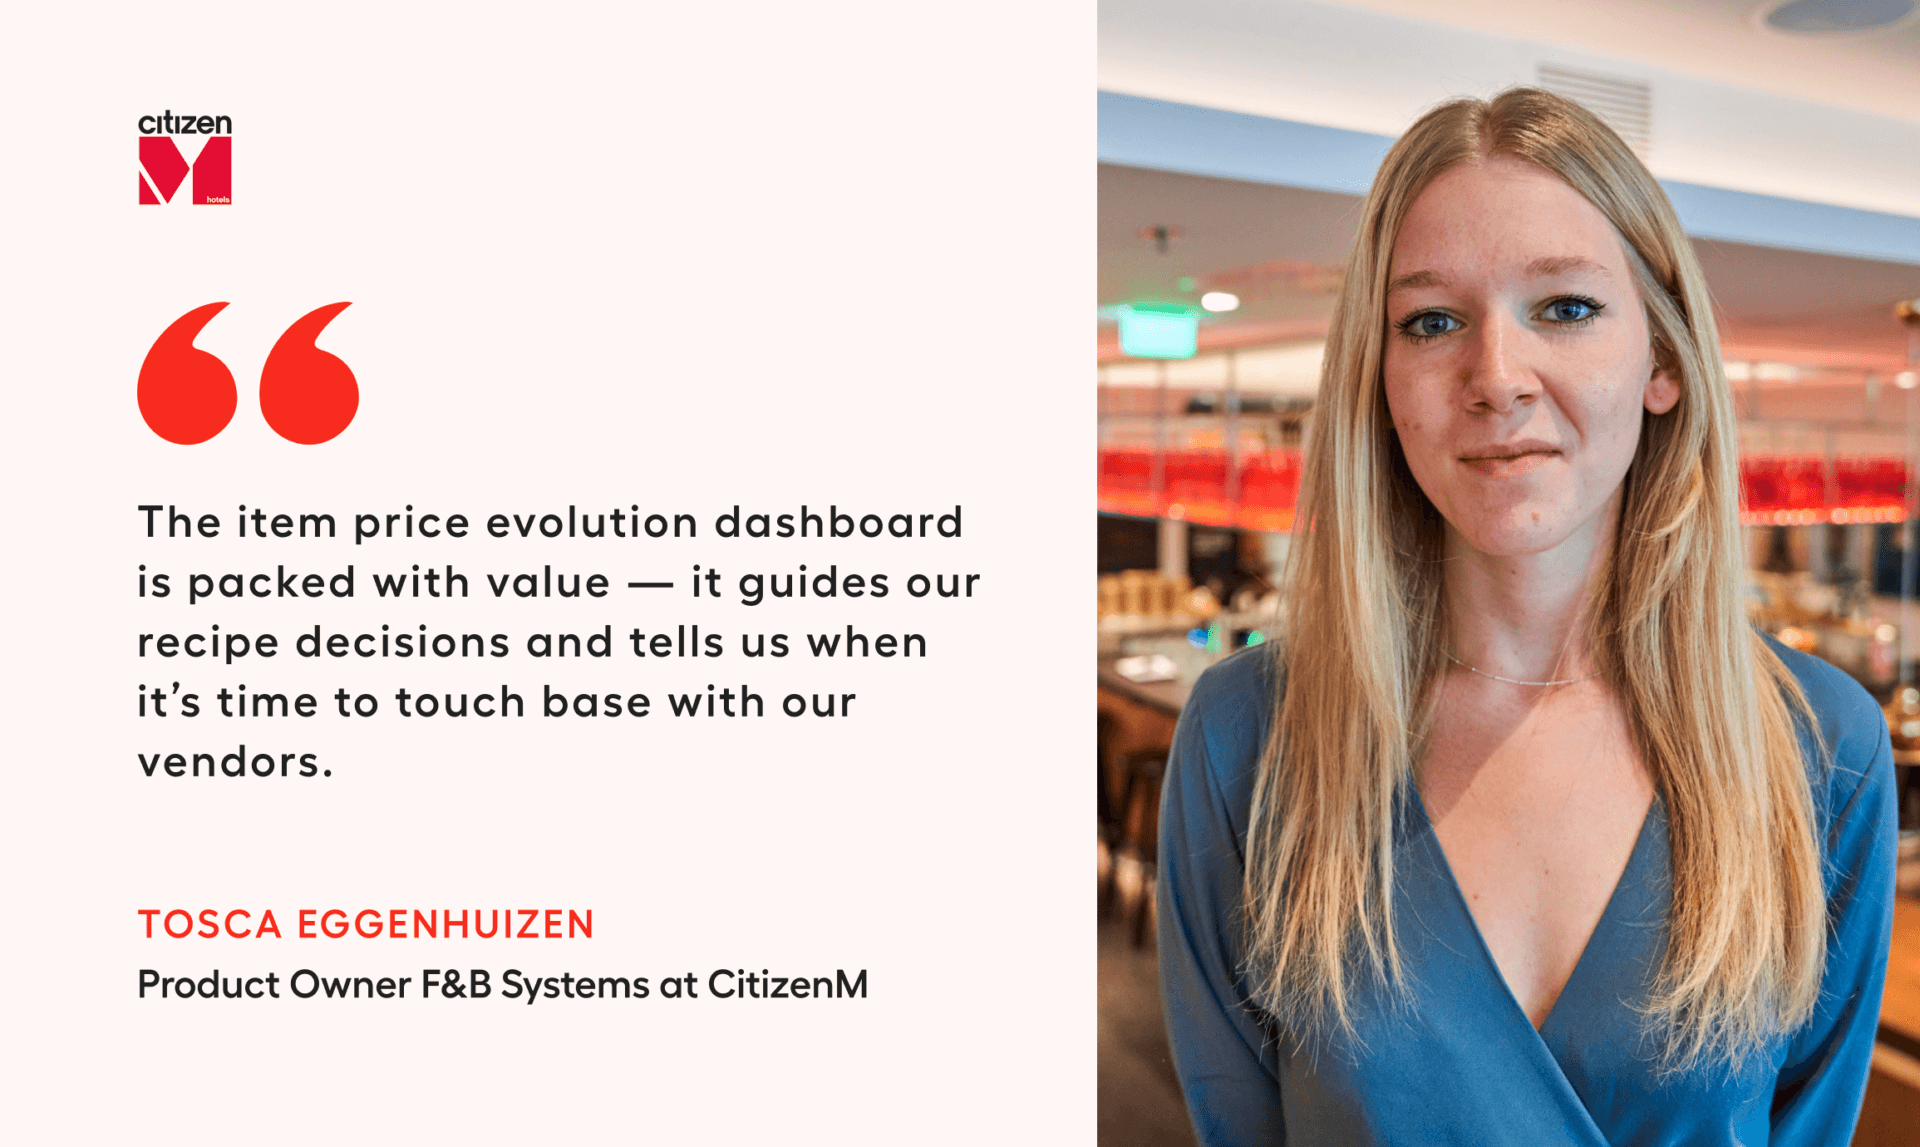
#2 Keep tabs on item price evolution to safeguard menu profitability
Item price evolution dashboard gives you an instant overview of all your ingredients. It tracks all the ingredient price changes so you don’t have to go digging for them. If a vendor changes prices unilaterally, you can act; follow up, ask for clarification, enforce or renegotiate contract terms, or switch to a different vendor.
Use this dashboard as a menu profitability pulse-check. Even small vendor-side changes in pricing can lead to a substantial food cost increase for some menu items. Keeping track of them gives you a chance to tweak recipes before they become unprofitable.
#3 Dial in on ordering practices to take advantage of bulk discounts
When you feed purchasing data into an F&B analytics platform, you get access to this gem of an insight — knowing how much and how often each outlet orders.
This way, you can identify small orders that don’t benefit from your negotiated pricing deals.
Once you find these outlets, instruct managers there to meet minimum quantities required for discounts (if storage permits). Alternatively, shift these small orders to the central kitchen to lower their cost, and arrange transfers. Your analytics platform will tell you if/when that move results in savings).
#4 Identify outlets and chefs that engage in rogue purchasing
It’s normal for some outlets to occasionally run out of ingredients in mid-shift. The chef might send someone to the nearest grocery store when that happens. These unplanned runs are called rogue purchases and will impact your bottom line.
Rogue spending is notoriously difficult to notice.
Keeping tabs on it becomes much easier when you can track every ingredient and connect it to a vendor. If you can see that some of your ingredients are in the negative (meaning the kitchen sent out a dish for which there were no ingredients in the system), you can assume unregistered intake. Set a firm threshold for rogue purchases.
The goal is to reduce them to zero.
If some outlets or chefs do them all the time, review their ordering practices, and chat with the staff members responsible for inventory planning.
Restaurant Sales Insights
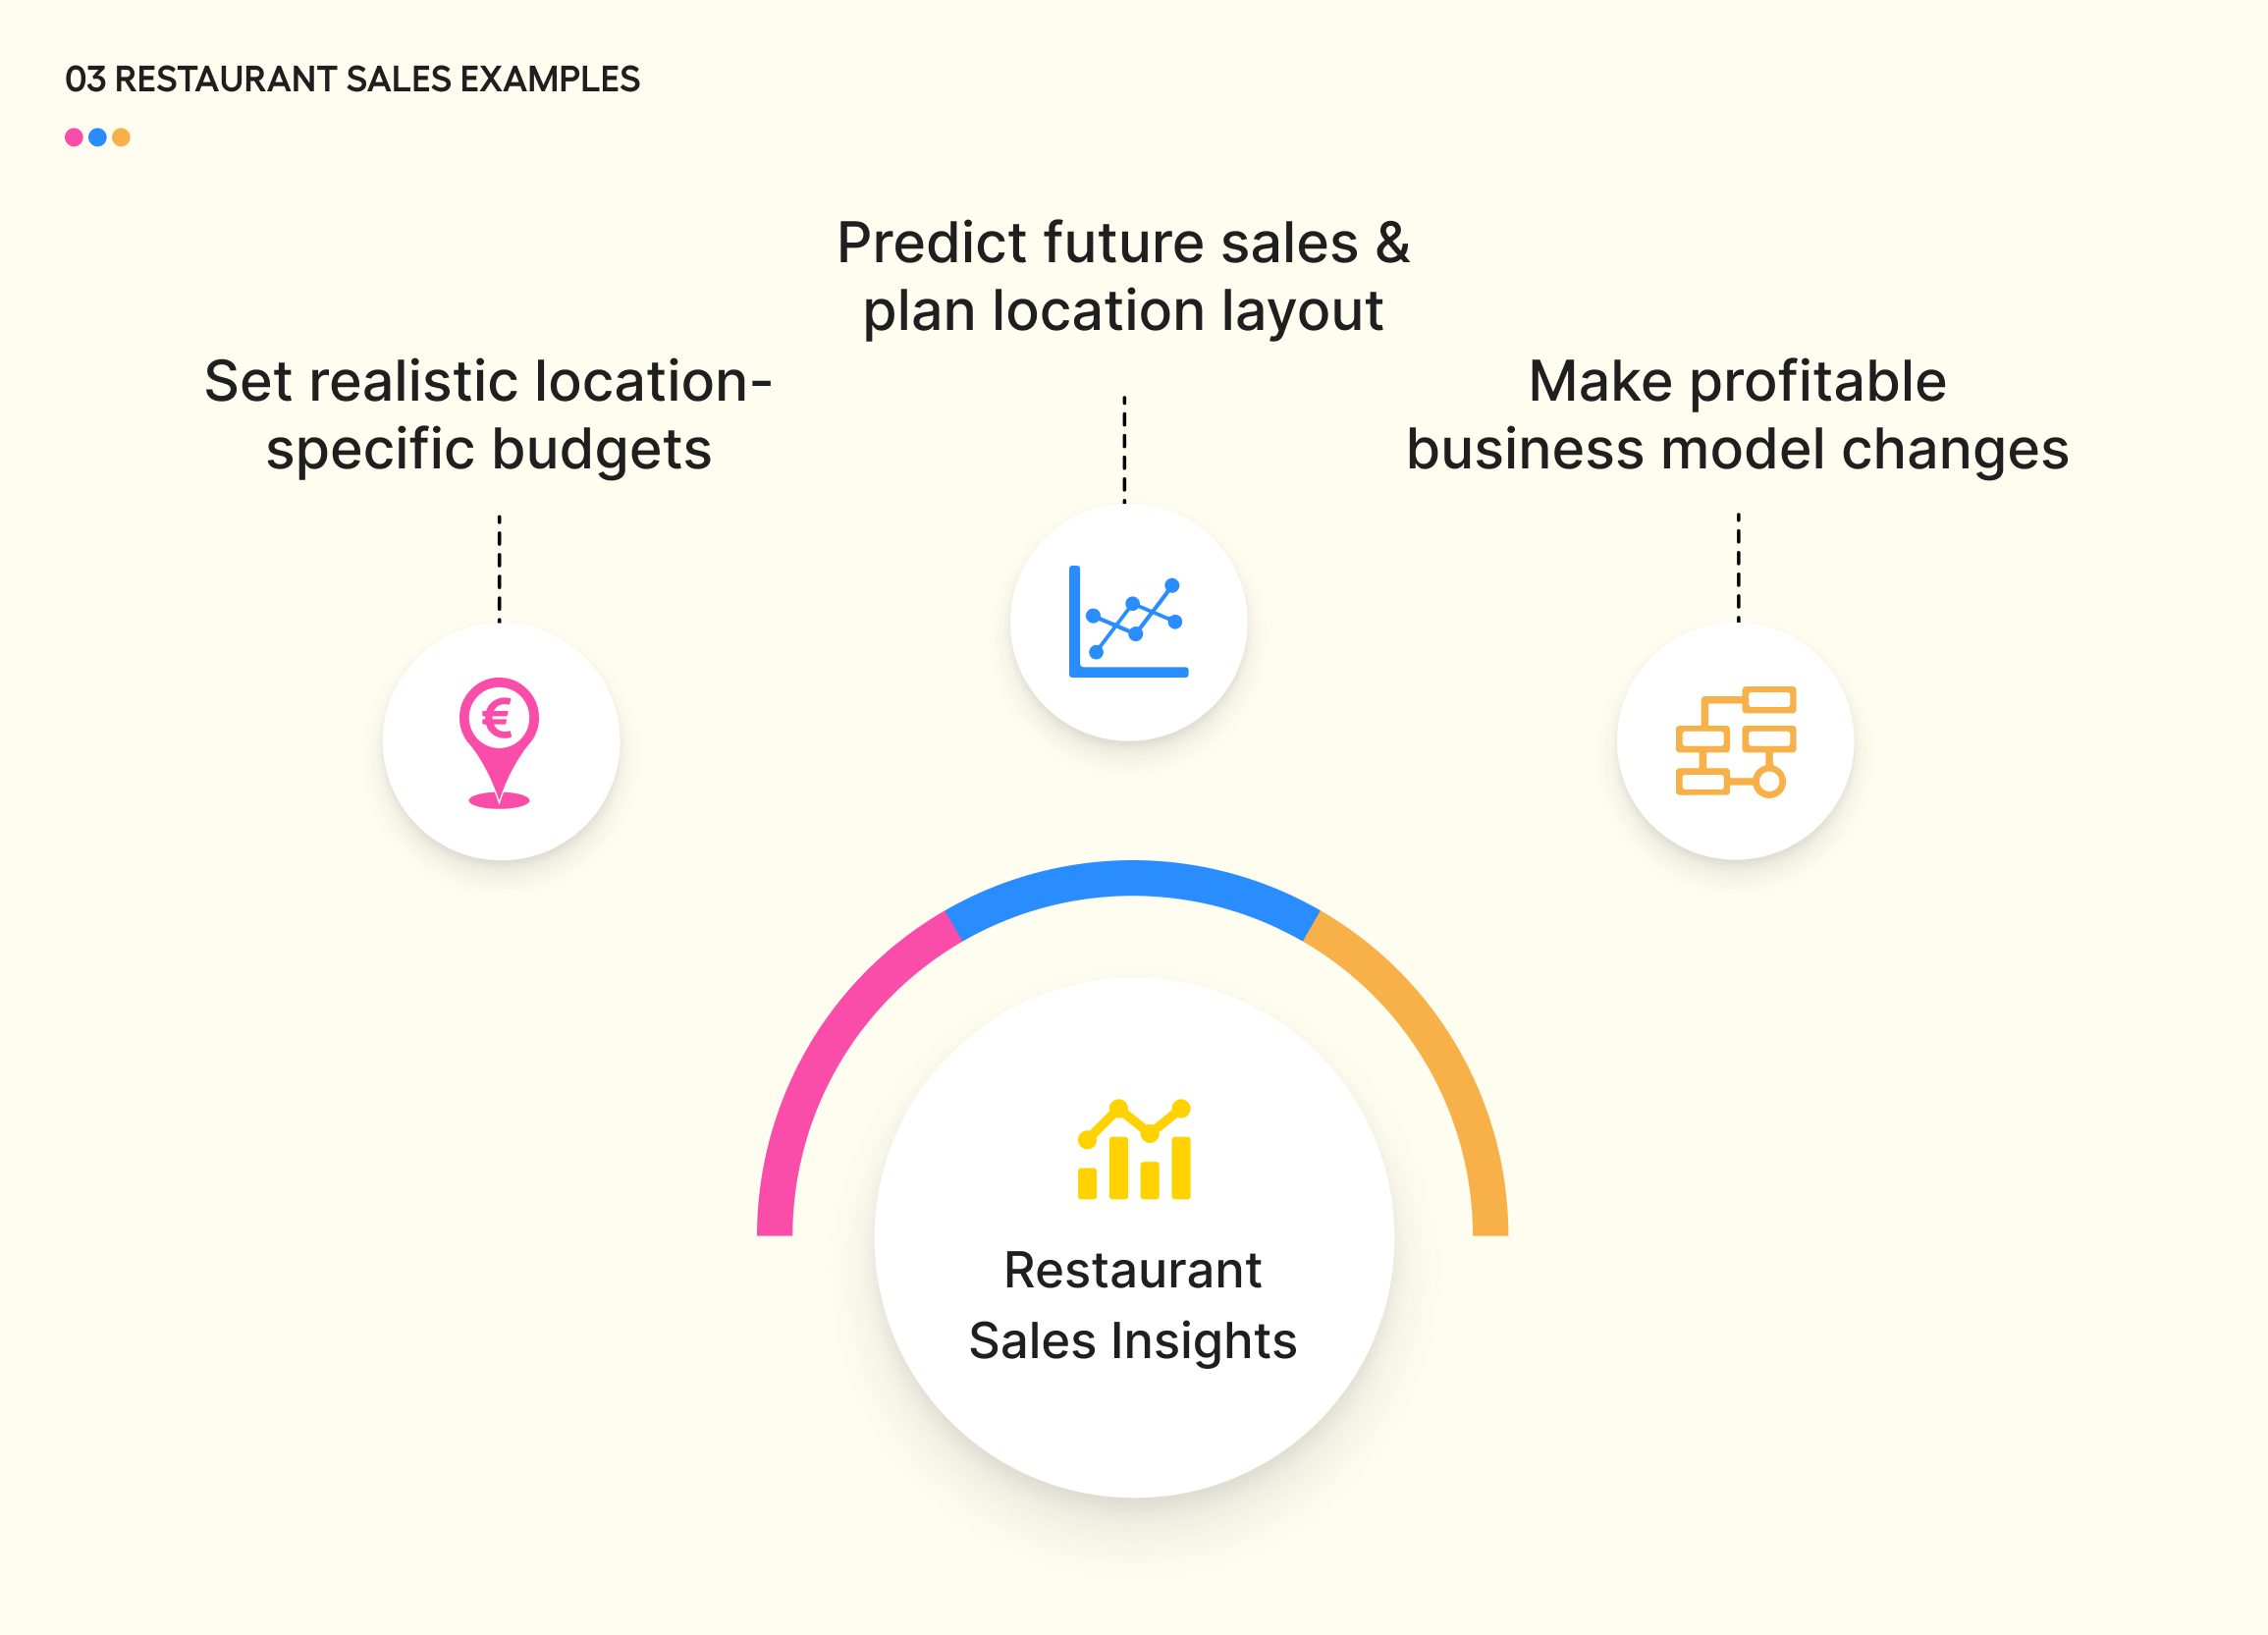
#5 Set realistic location-specific budgets by looking at historical sales trends
With accurate location-specific sales insights, your budgeting decisions become hyper-focused. You don’t have to ‘approximate’ anything because the recommendations are rooted in monthly/yearly trends. So instead of budgeting for six months (and ending up way off), you can now budget monthly or weekly (and be right on the money).
Getting that projection budget as close to 100 per cent accurate improves your operational planning. For example, if you exceed your first quarter’s targets, you can start thinking about growth initiatives. If you’re just under your targets, you can look at the cost side of things to see where you can make cuts. Or review your marketing efforts.
And if you’re falling really short, you can decide to postpone that expansion plan until you can figure out what went wrong under the hood.
#6 Predict future sales & plan location layout based on customer data
There are many ways you can use customer data to eke out an extra profit on the front end, for example by forecasting demand. Here are just a few examples of insights you’ll get once you plug this data into your F&B analytics hub:
- Group size data — Plan your dining area layout to maximise your profits. If you usually serve small groups (individuals or couples), get smaller tables so you can fit more of them. To serve larger groups, have a plan to connect tables in a way that doesn’t reduce your overall occupancy numbers.
- Revenue per group size — High revenue? Make sure you’re fully staffed at all times since these guests pay well for food and for an experience (if you make them wait, they likely won’t come back).
Low revenue? You can consider scheduling fewer servers during peak hours if the increased labour cost will eat into your profits. I’d advise doing this only if you run a QSR and don’t serve regulars — long wait times are a revenue-killer in and of themselves. - Low footfall on certain days — Let’s assume traffic and sales for one of your locations drops off a cliff every third Monday of the month (summer months only). This might be down to a change in bus/tram schedules, an office building not working, or anything else. This is a hard pattern for a human to notice. But it’s a prime example of a relevant restaurant analytics insight that can guide your decisions. Now that you know about it, you can choose to close shop that day or run a skeleton crew to minimise labour costs.
#7 Make profitable business model changes thanks to distribution channel data
Most F&B operators are cautious when experimenting with their business model. Decisions around changing existing or adding new distribution channels move at a snail’s pace because they risk disturbing a profit-generating model.
So how do you still take these — potentially very profitable — chances while minimising the risk to your existing operation?
It comes down to control.
Through analytics, you can closely watch all your distribution channels and evaluate them in real time. For example, if you operate a dine-in chain and offer takeout, you can arrange extra hands in the kitchen on those days when takeout is up. If this proves profitable, you can look into adding a separate takeout window + meal prep area to some of your outlets. With a small marketing push, this can become a profitable revenue stream that you scale.
The point is, you’re in control — you have visibility — and you quickly evaluate the profitability of every channel you decide to pursue.
Same with third-party deliveries.
Menu & Menu Engineering Insights
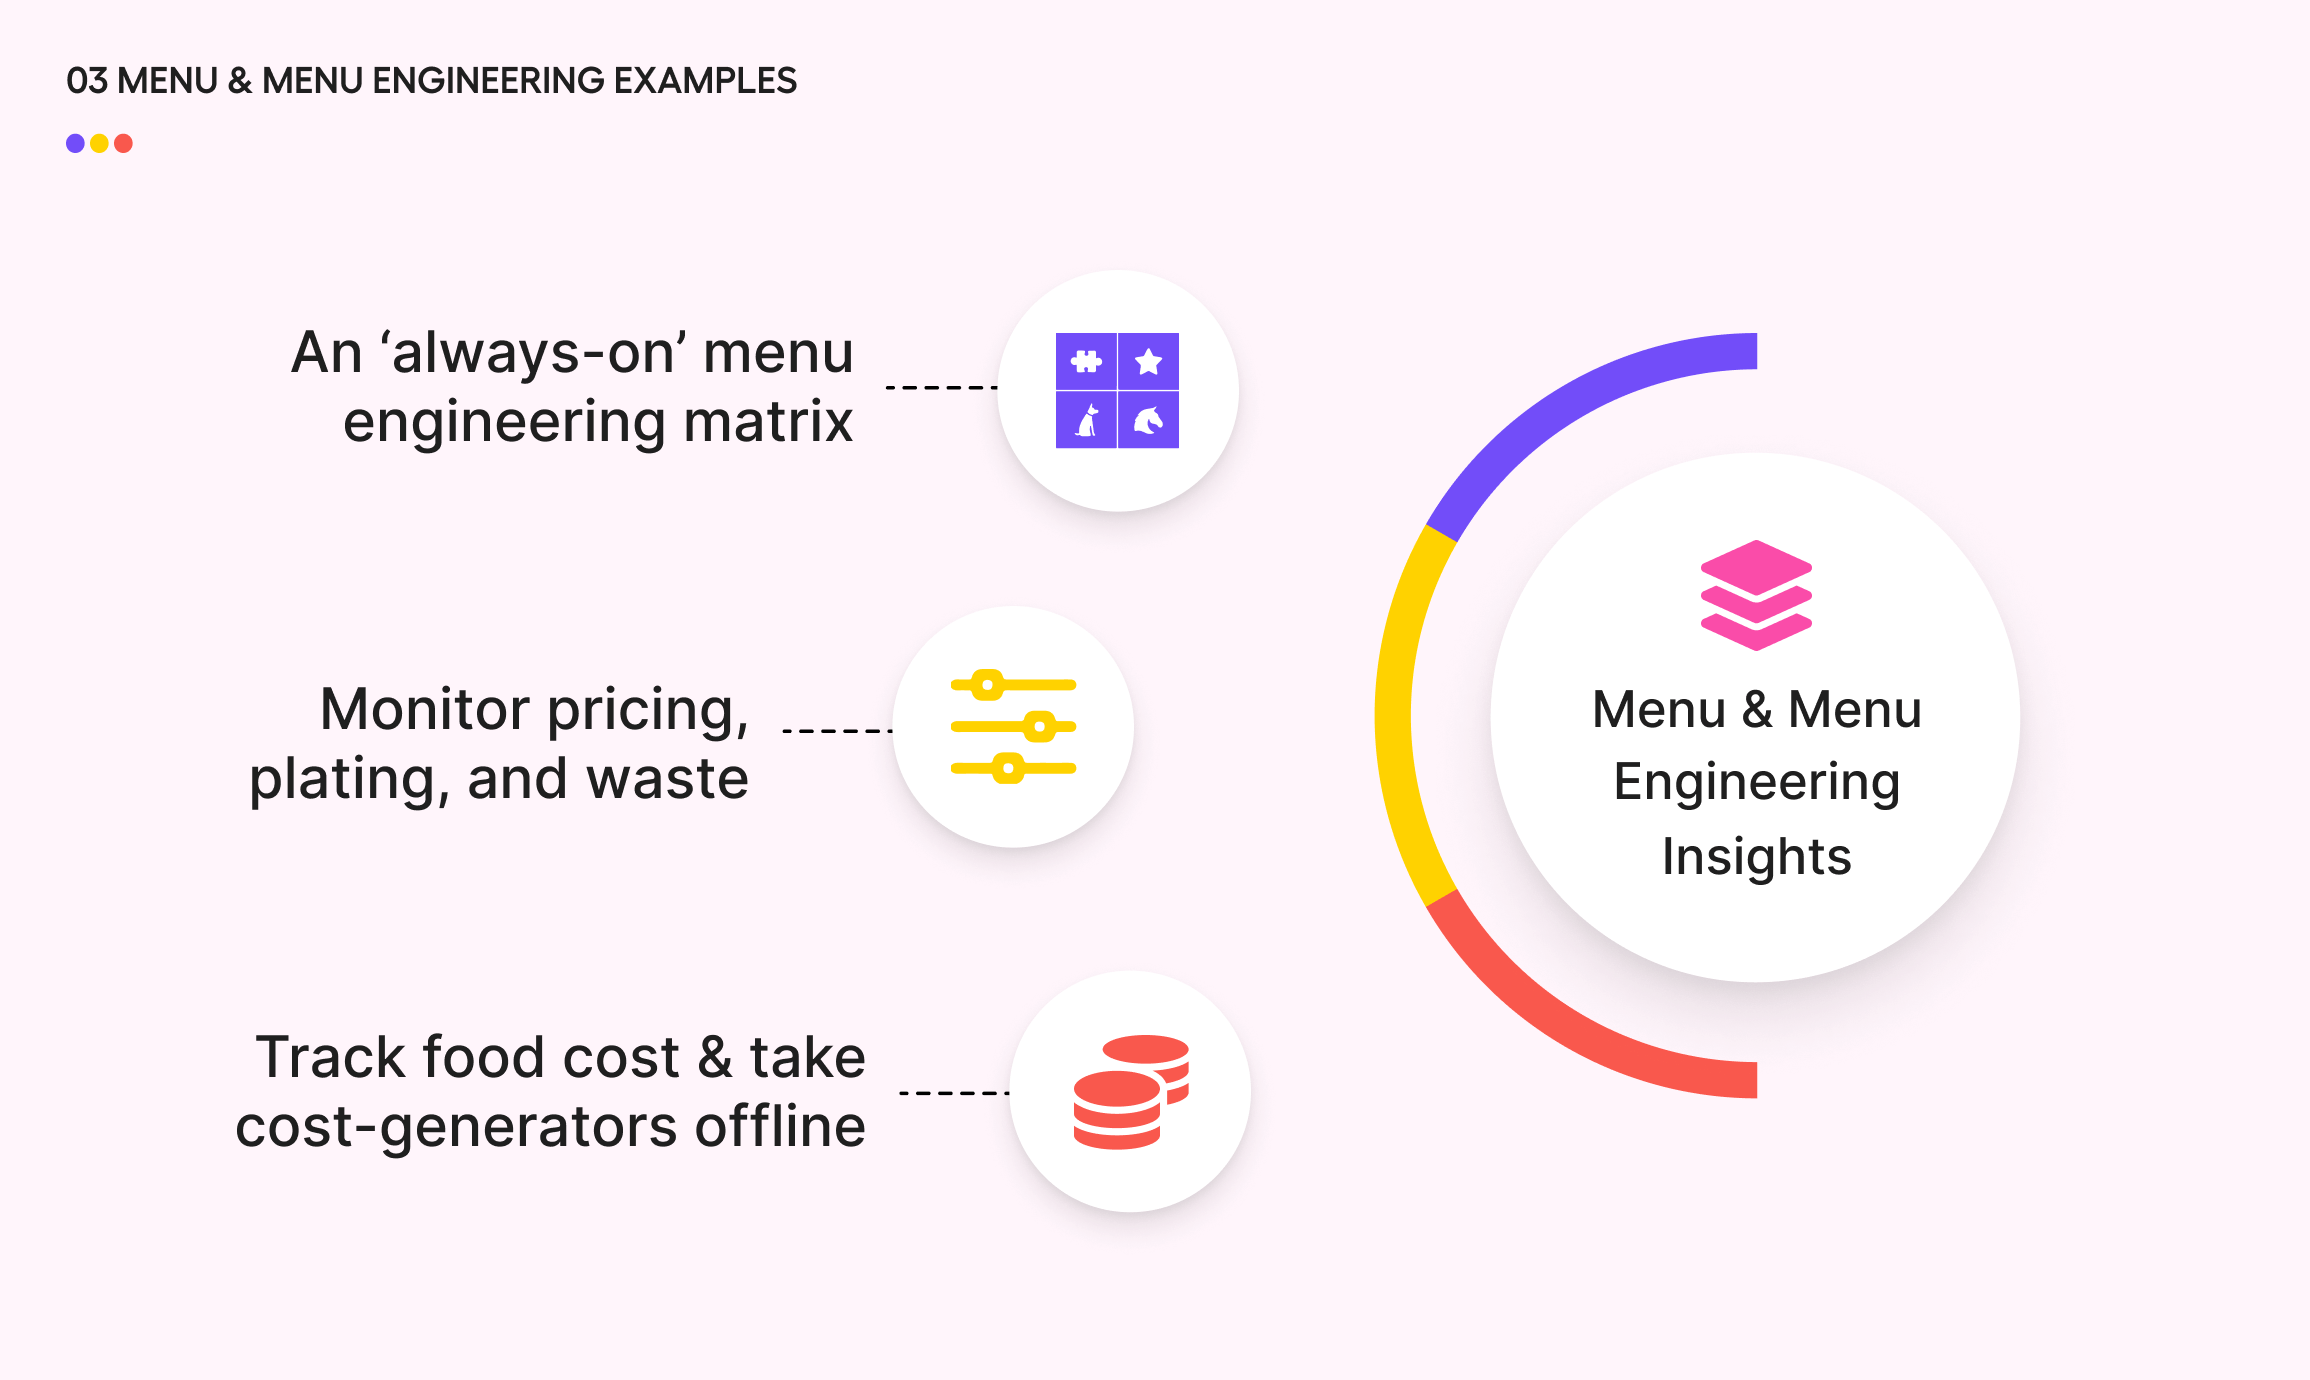
#8 Stay on top of menus with an ‘always-on’ menu engineering matrix
Analytics can run your menu profitability and popularity calculations around the clock. Where you’d have to lose days per outlet in the past, you now have access to accurate, real-time data at the drop of a hat.
Now, you make location-specific decisions that affect the bottom line, such as:
- incentivise customers to order items with a high margin that are not selling well;
- instruct servers to push the highest margin items when asked for recommendations;
- remove dishes that are losing money (or rethink the recipes so they’re profitable).
This uninterrupted tracking of menu profitability turns menu engineering into a series of gradual profit-boosting tweaks, instead of a once-a-year Hail Mary where you crunch the numbers and hope you haven’t accidentally murdered your entire concept.
Recommended reading: Menu Engineering (How to Add 10-15% to Your Bottom Line by Tweaking Menus)
#9 Monitor how pricing, plating, and waste are affecting the health of your menus
With around-the-clock F&B insights, you’re not relying on your P&L to tell you there’s something iffy with your menus. Instead, you see it immediately, so you act immediately. For example, Apicbase lets you set up menu matrix category overviews (starters, mains, desserts). This way, you track their performance in real time.
When an item becomes unprofitable or unpopular, you can evaluate the usual suspects — vendor prices, waste, or overplating. Once you identify the culprit, you can take steps (pausing sales, switching up ingredients, or instructing staff on plating quantities) before your profits get hit.
#10 Track food cost on recipe level & take serious cost-generators offline
Running food cost calculations for your entire menu — and doing it often enough to make a difference — takes a lot of time.
If you’re doing it all manually, that is.
Restaurant analytics platforms like Apicbase do it for you. All you need to do is periodically review the recipes dashboard to see if (and by how much) the rising food costs are eating into your profit margin. So instead of letting these food costs run amok, you can fix whatever is behind the increase.
Often, this will require you to take the item offline so you can dig deeper (check costed recipes, vendor prices and packaging, waste, and similar). But this is always preferable to ending up thousands in the red after months of selling an item that’s not even breaking even. Once you know what’s happening, you can try reducing portion size, tweaking ingredients, or substituting expensive sides for cheaper ones to resuscitate your profit margin.
Recommended reading: Menu Costing: How to Automate Menu Calculations & Eliminate Low-Margin Items
Employee & Labour Insights
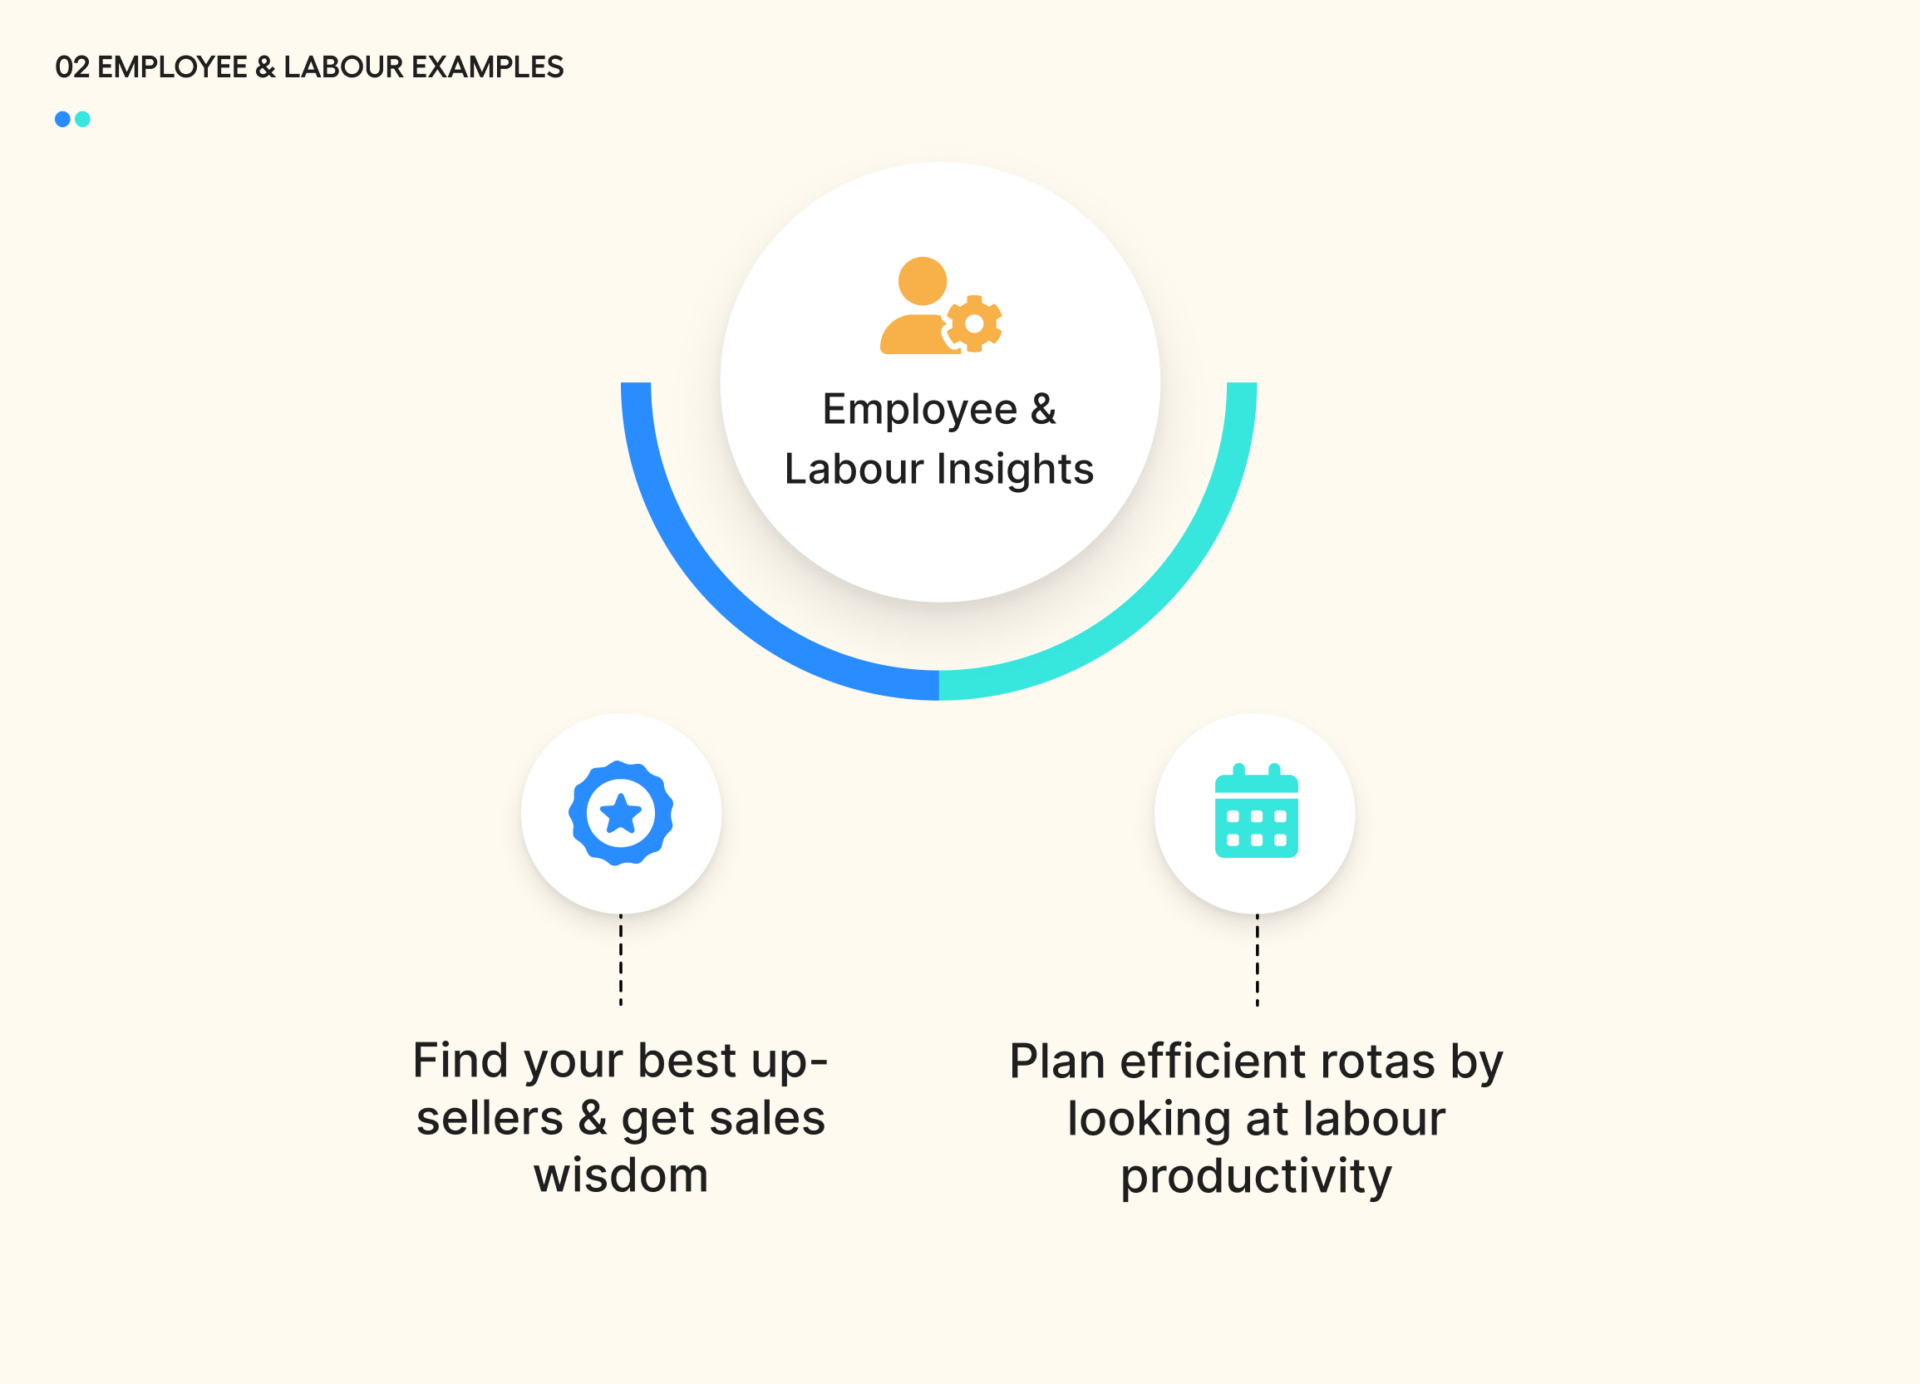
#11 Find your best up-sellers & get them to share their sales wisdom
Here’s one example of a restaurant analytics insight that can boost revenue by a few percentage points across your operation. All you’re doing here is figuring out who your best staff members are — the servers that can easily upsell diners on your most expensive menu items — and finding out what they’re doing differently.
Once you feed POS & employee-specific data into your analytics platform, you’ll immediately see which servers have the highest average transaction values. Pro tip — look for servers who do exceptionally well in usually slow shifts (Mondays or Tuesday mornings). These are the people who know how to sell. Meet them (or even shadow them as they work), so you can figure out what they’re doing differently. Add what you learn to the server training manual… or you could have those sellers hold training sessions for the rest of your team.
#12 Plan efficient rotas by looking at labour productivity
Managers In medium/large operations often schedule staff by approximating daily workloads and looking at sales trends. But, if you can break productivity into hours, you can further maximise profits by ensuring none of your servers are sitting around doing nothing.
Sales per labour hour schedule is an example of a front-of-the-house restaurant insight that will allow you to make those scheduling decisions confidently. Having that cut-off point (for example, a rule that says that sales should never be lower than EUR 45 per labour hour scheduled) lets you know if you’re effective at scheduling your employees.
Restaurant Business Insights Answer Your Real Questions…
‘Should we open our new locations in the third quarter… or the fourth?’
‘Why is our menu profitability dipping & what can we do about it?’
‘How much can we push this one vendor to lower their prices?’
You know, real business questions… with an actual business benefit you get when the answer is tailored to your operation.
And while restaurant analytics is not a Magic 8-Ball — it will not do the work for you.
But…
Insights from analytics do point you in the right direction. They frame data and make it actionable, giving context to often confusing rows of numbers. Most importantly, insights let you react to things as they happen, so you don’t have to depend on your outdated P&L statements or, worse yet, hunches.
The trick to winning in the F&B industry is working smarter… not harder.
And you can start working smarter today with Apicbase’s restaurant analytics.
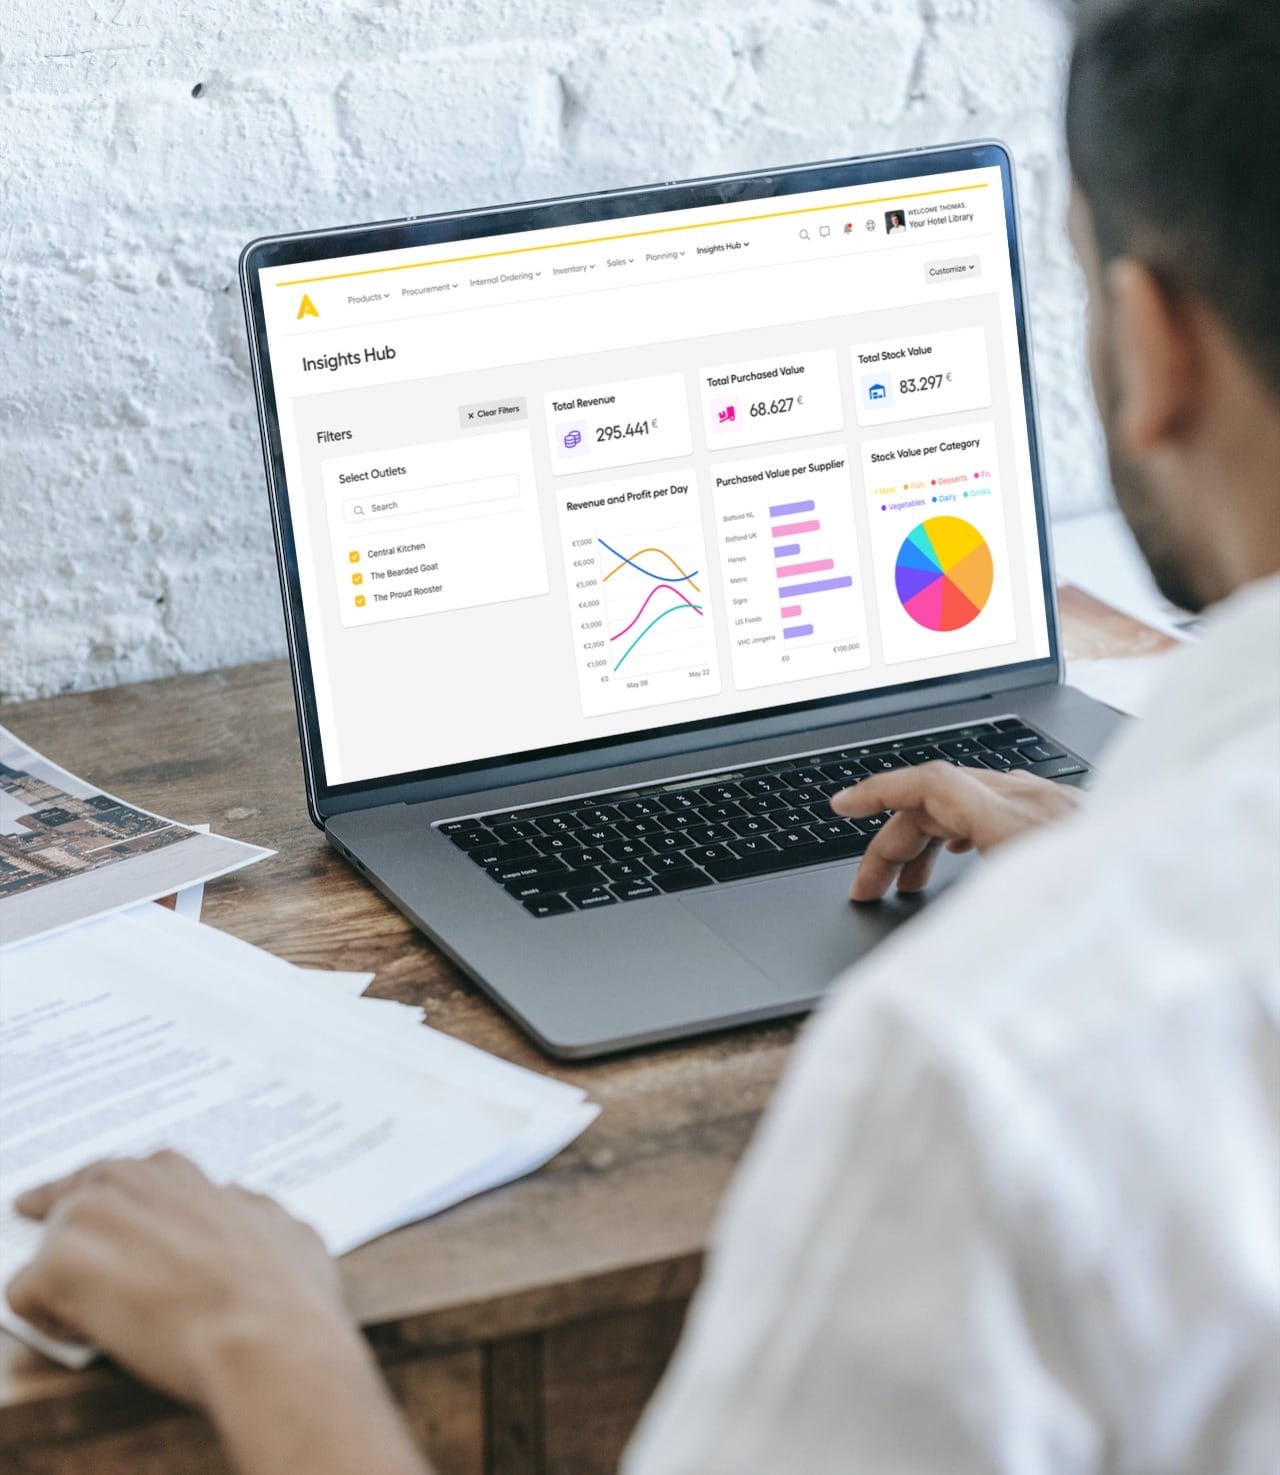
See Apicbase’s Insights Hub in Action
Preview how Apicbase’s data analytics helps bolster the profitability of your multi-unit restaurant.