Restaurant analytics software turns raw data into powerful performance dashboards packed with insightful graphs and charts about your food costs, revenues, F&B inventory, and purchasing. Track growth, spot discrepancies, and help your teams make the right call at every turn.
Updating spreadsheets is time-consuming and error-prone. Leave all that data entry behind, tap into our visualisations, and get a clear overview of your back of house foundations.
Inventory management
Get a clear view of your inventory, stock movements, transfers, and variance—so you can stay on top of spending and food waste across all your restaurant locations.
Procurement precision
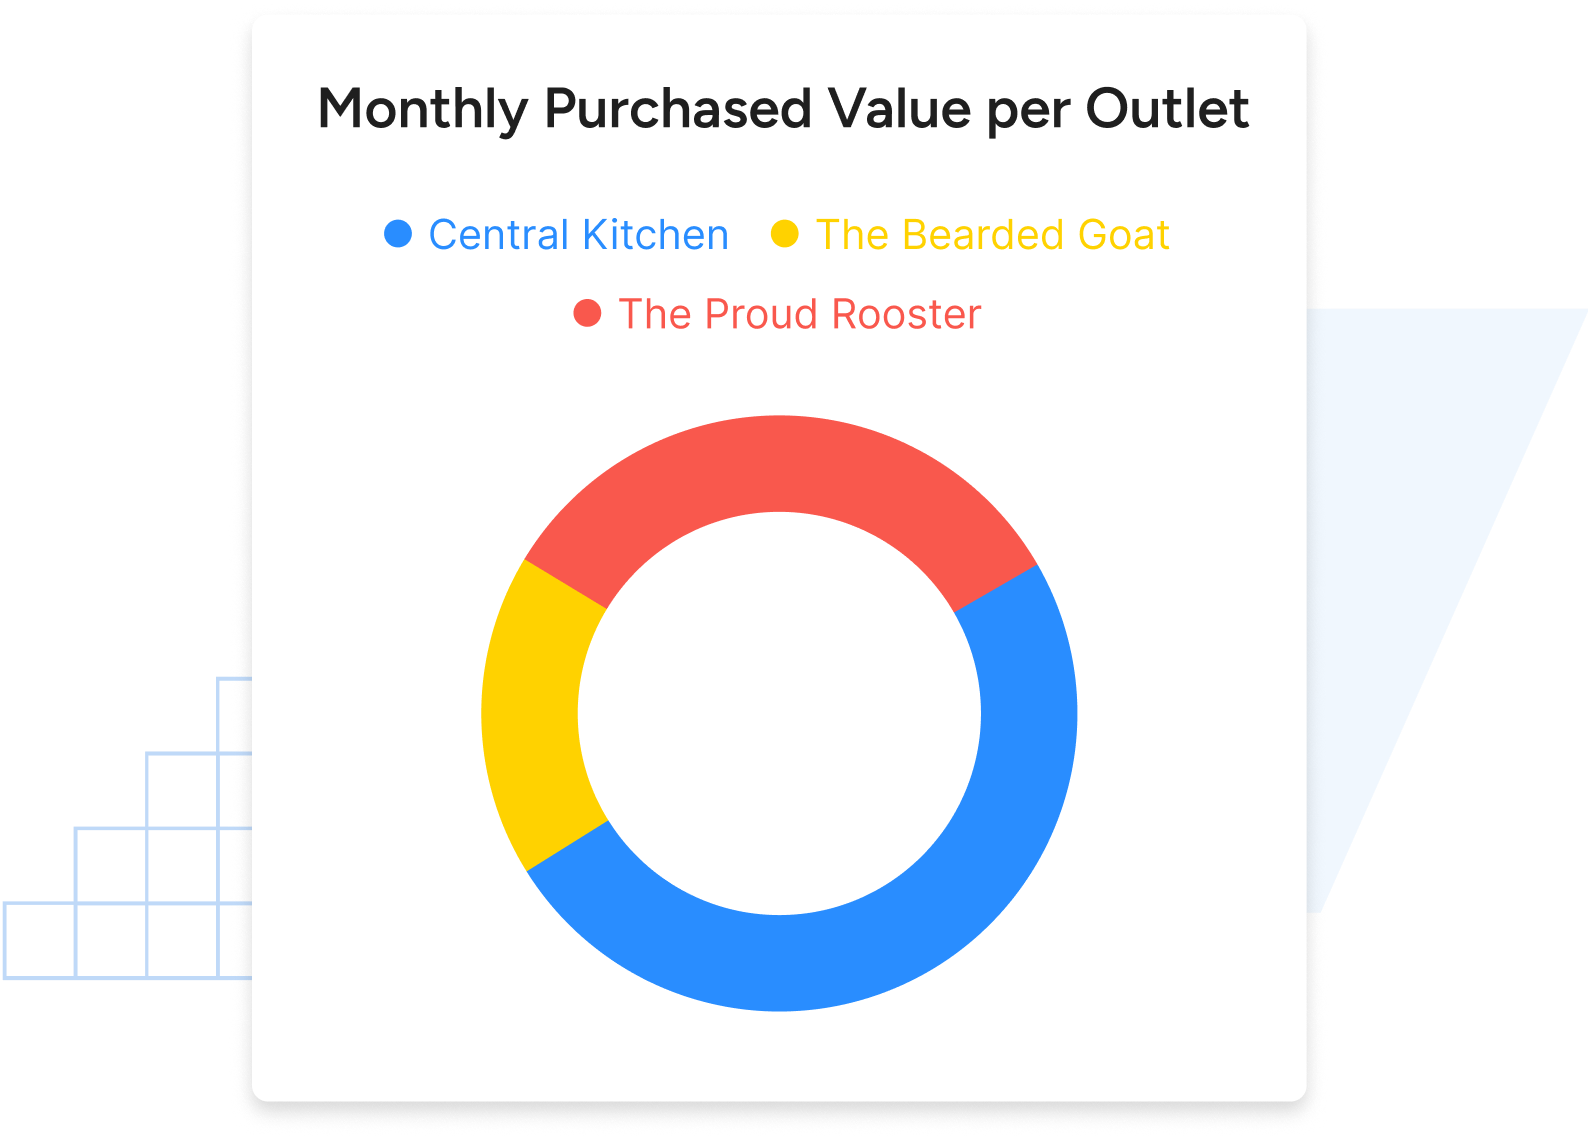
Visualise company-wide
purchasing trends, the order values per supplier, and purchasing behaviour of each store. Analytics software is the best tool to optimise your food costs.
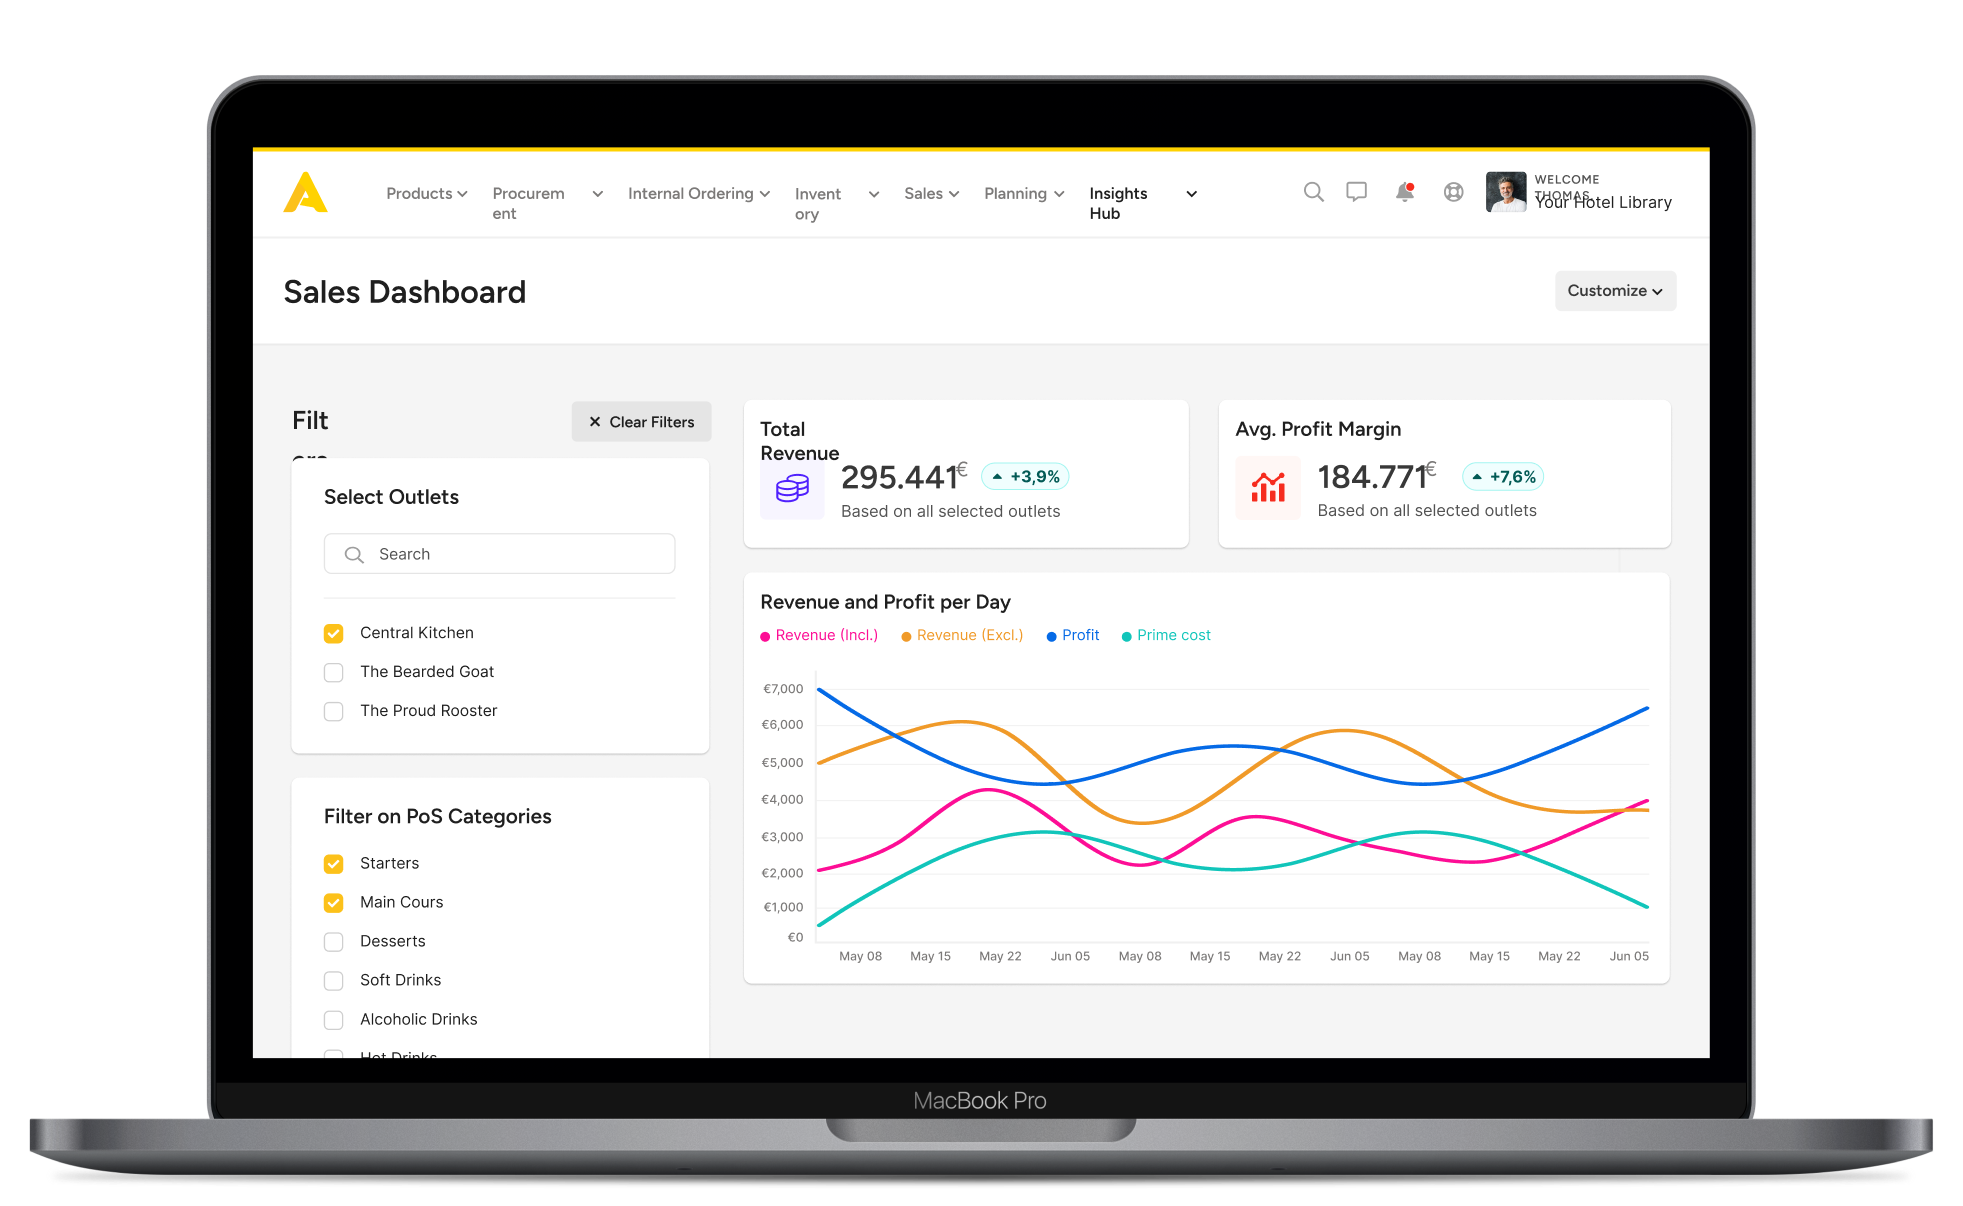
Sales insights
Improve your profit margins. Our dashboards show opportunities for better cost control. They bring together your sales data, inventory usage, and cost of goods sold.
Compare the performance of all your restaurants without using Excel.
Our group analytics functionality lets you skip the messy number-crunching. This shortens your reaction time, so your underperforming locations get the attention they need when they need it.
Collaborate with store managers
Save your managers from drowning in data by giving them performance-building graphics and insights.
Make profit-boosting moves
You can’t trust numbers wrangled from error-prone spreadsheets. Upgrade to dashboards and level up your decision-making.
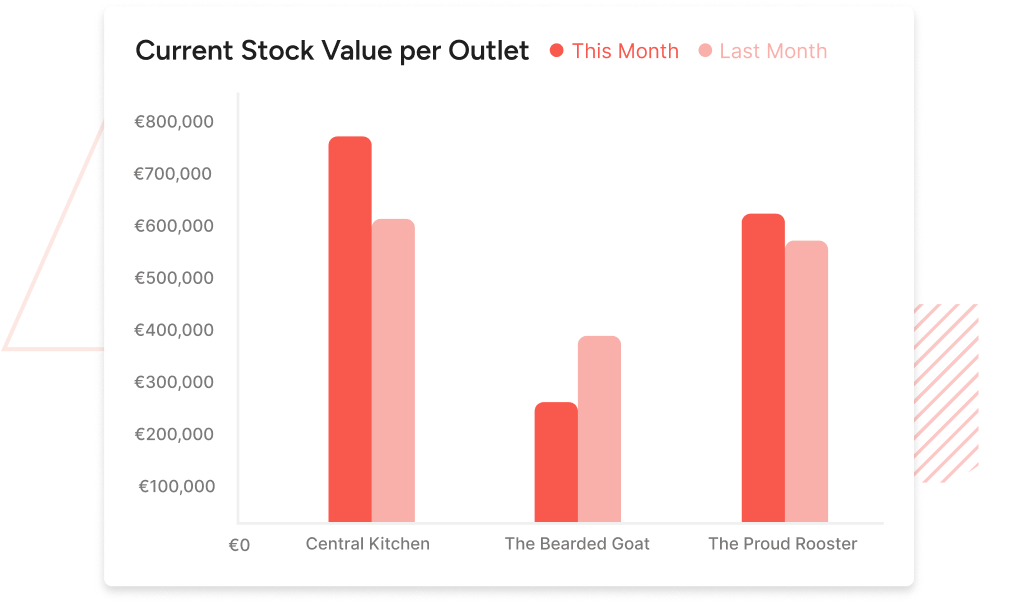
View inventory value per outlet
Quickly identify underperforming locations, pinpoint exactly what's going wrong, and implement targeted solutions to rebuild them stronger than ever.
Restaurant inventory analytics dashboard
Stay on top of inventory
Keeping track of your biggest costs is essential, but as you grow, spreadsheets become increasingly complex, slowing progress. Our restaurant analytics software harmonises and visualises your inventory data across the board—from what stores purchase to what gets used. It gives you a clear picture of where your money’s going and how to spend it smarter.
Use inventory management ‘snapshots’ to know the value of stock in each location at any time. Move stock between stores to avoid food waste and reduce costs.
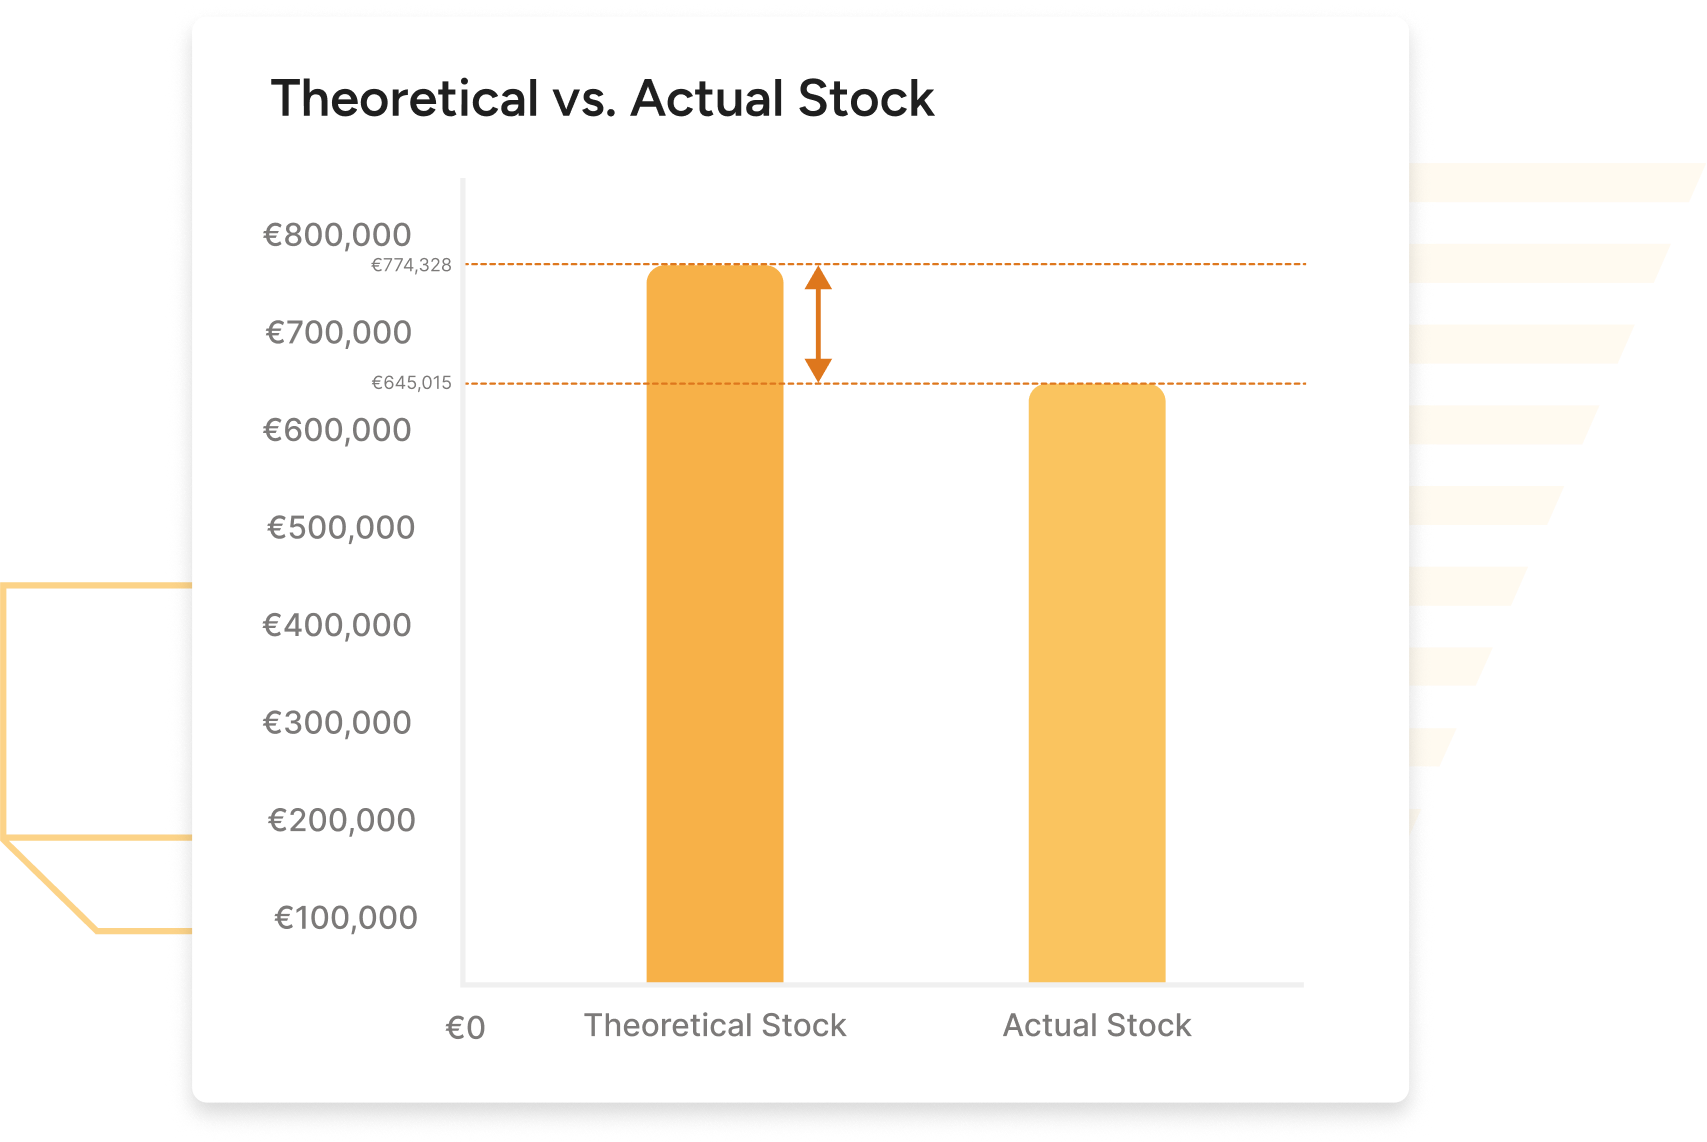
Understand restaurant inventory variance
Identifying the gap between your expected and actual inventory sheds light on operational areas that need improvement, such as purchasing practices, portioning, and theft prevention. Managing variance leads to better cost control, lean inventories, and higher profits.
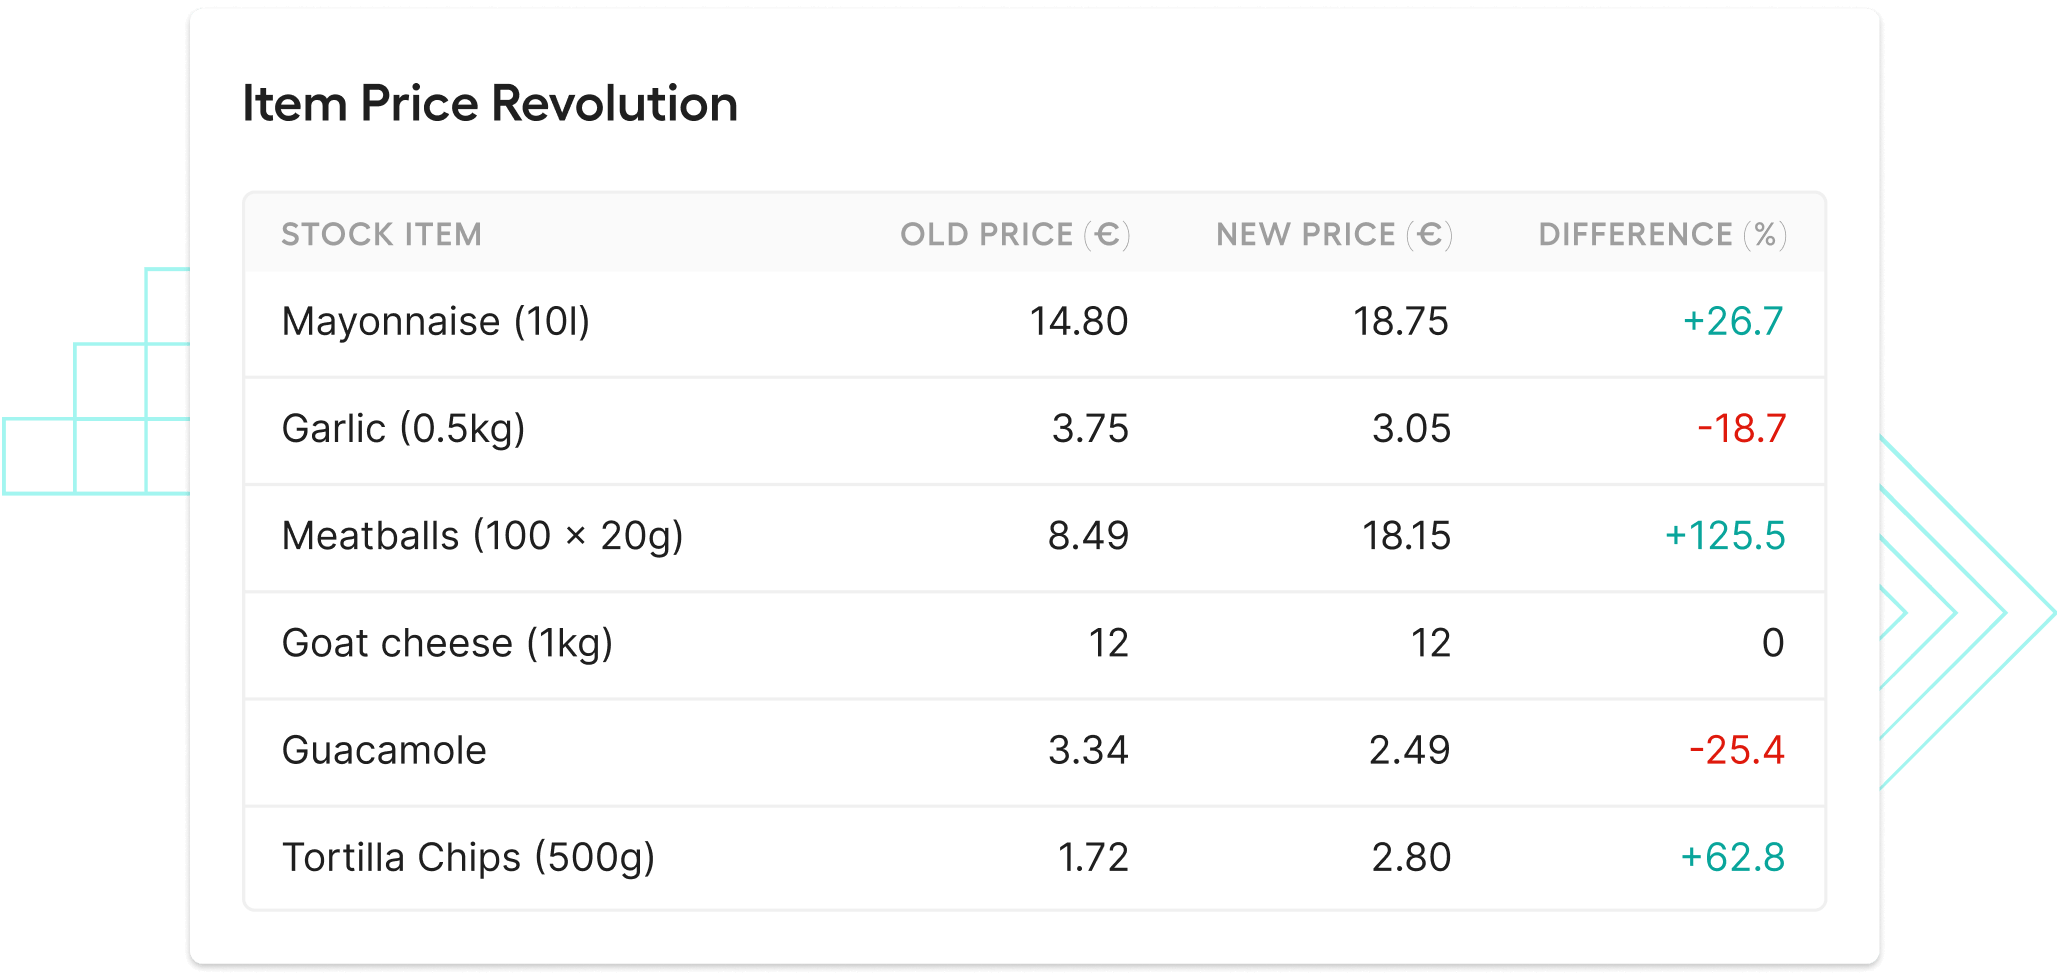
See item price evolution
Knowing item price trends allows you to create more profitable menus, rethink your costly recipes, and keep vendors in check.
The item price evolution dashboard is packed with value — it guides our recipe decisions and tells us when it’s time to touch base with our vendors.
Tosca Eggenhuizen
CitizenM
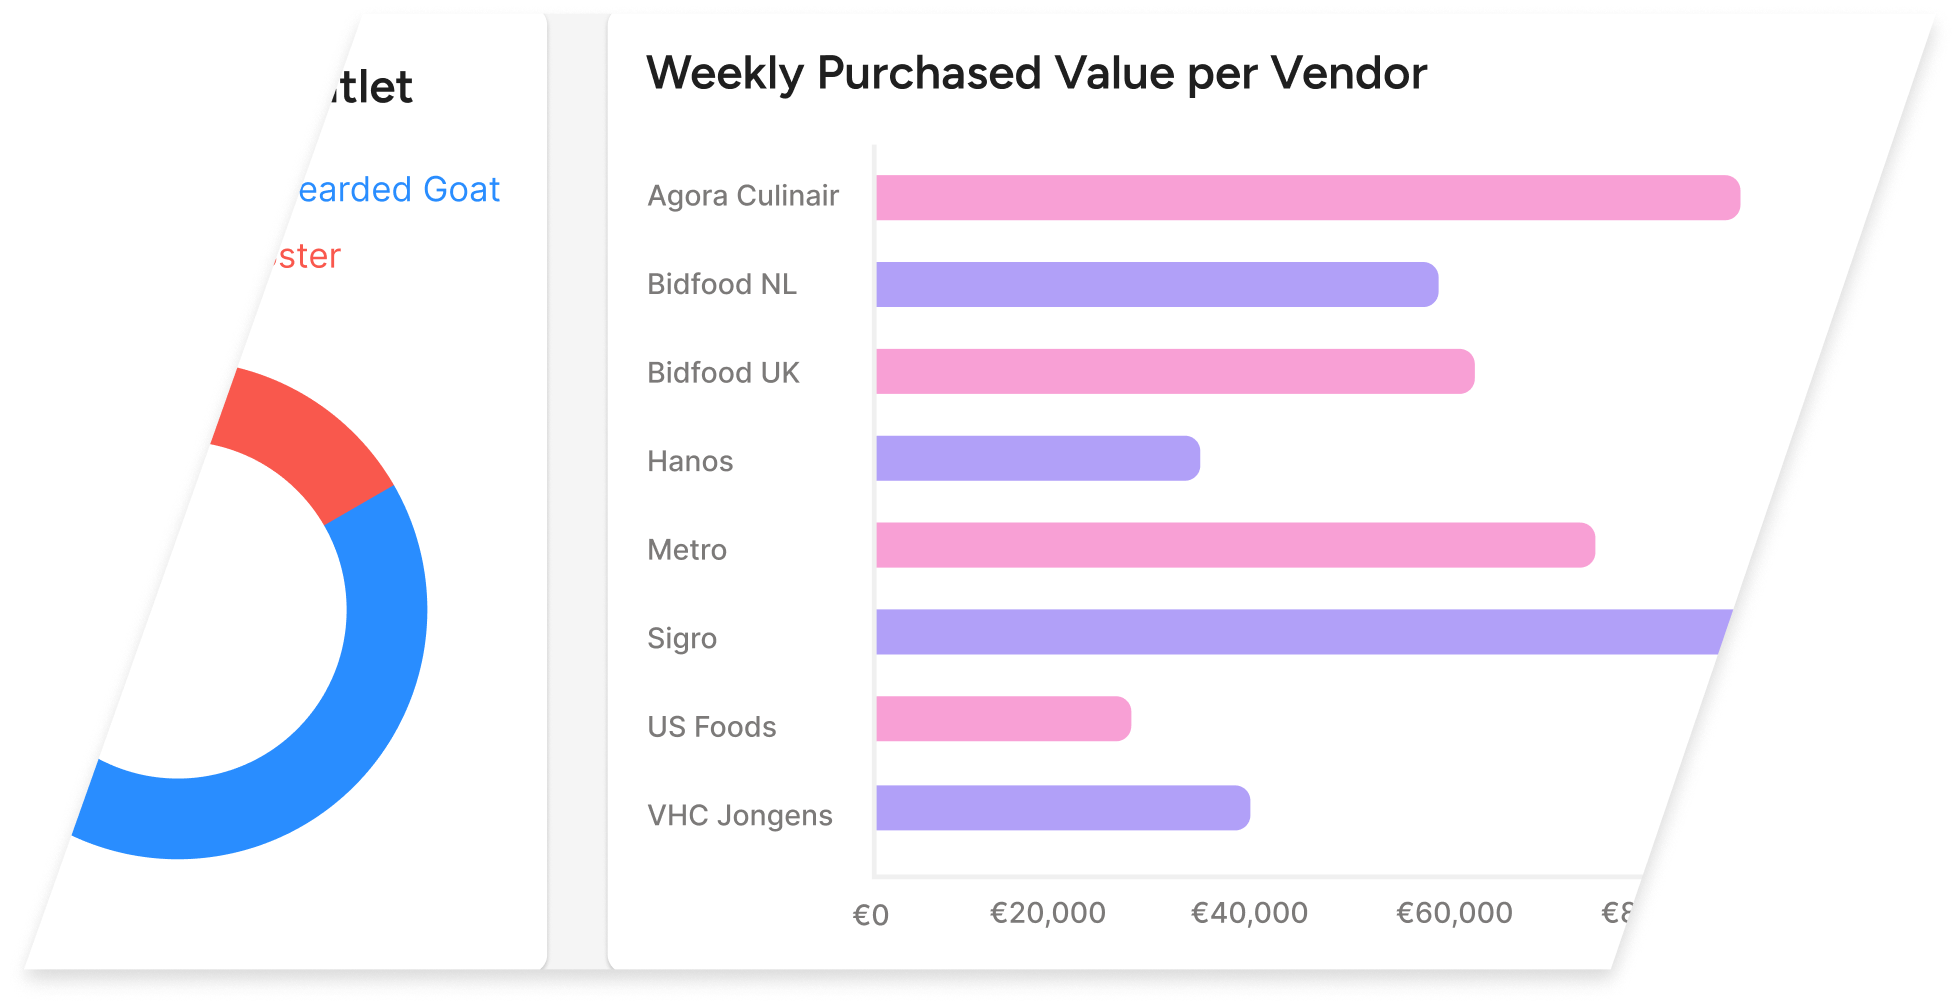
Restaurant procurement analytics dashboard
Get better deals from vendors
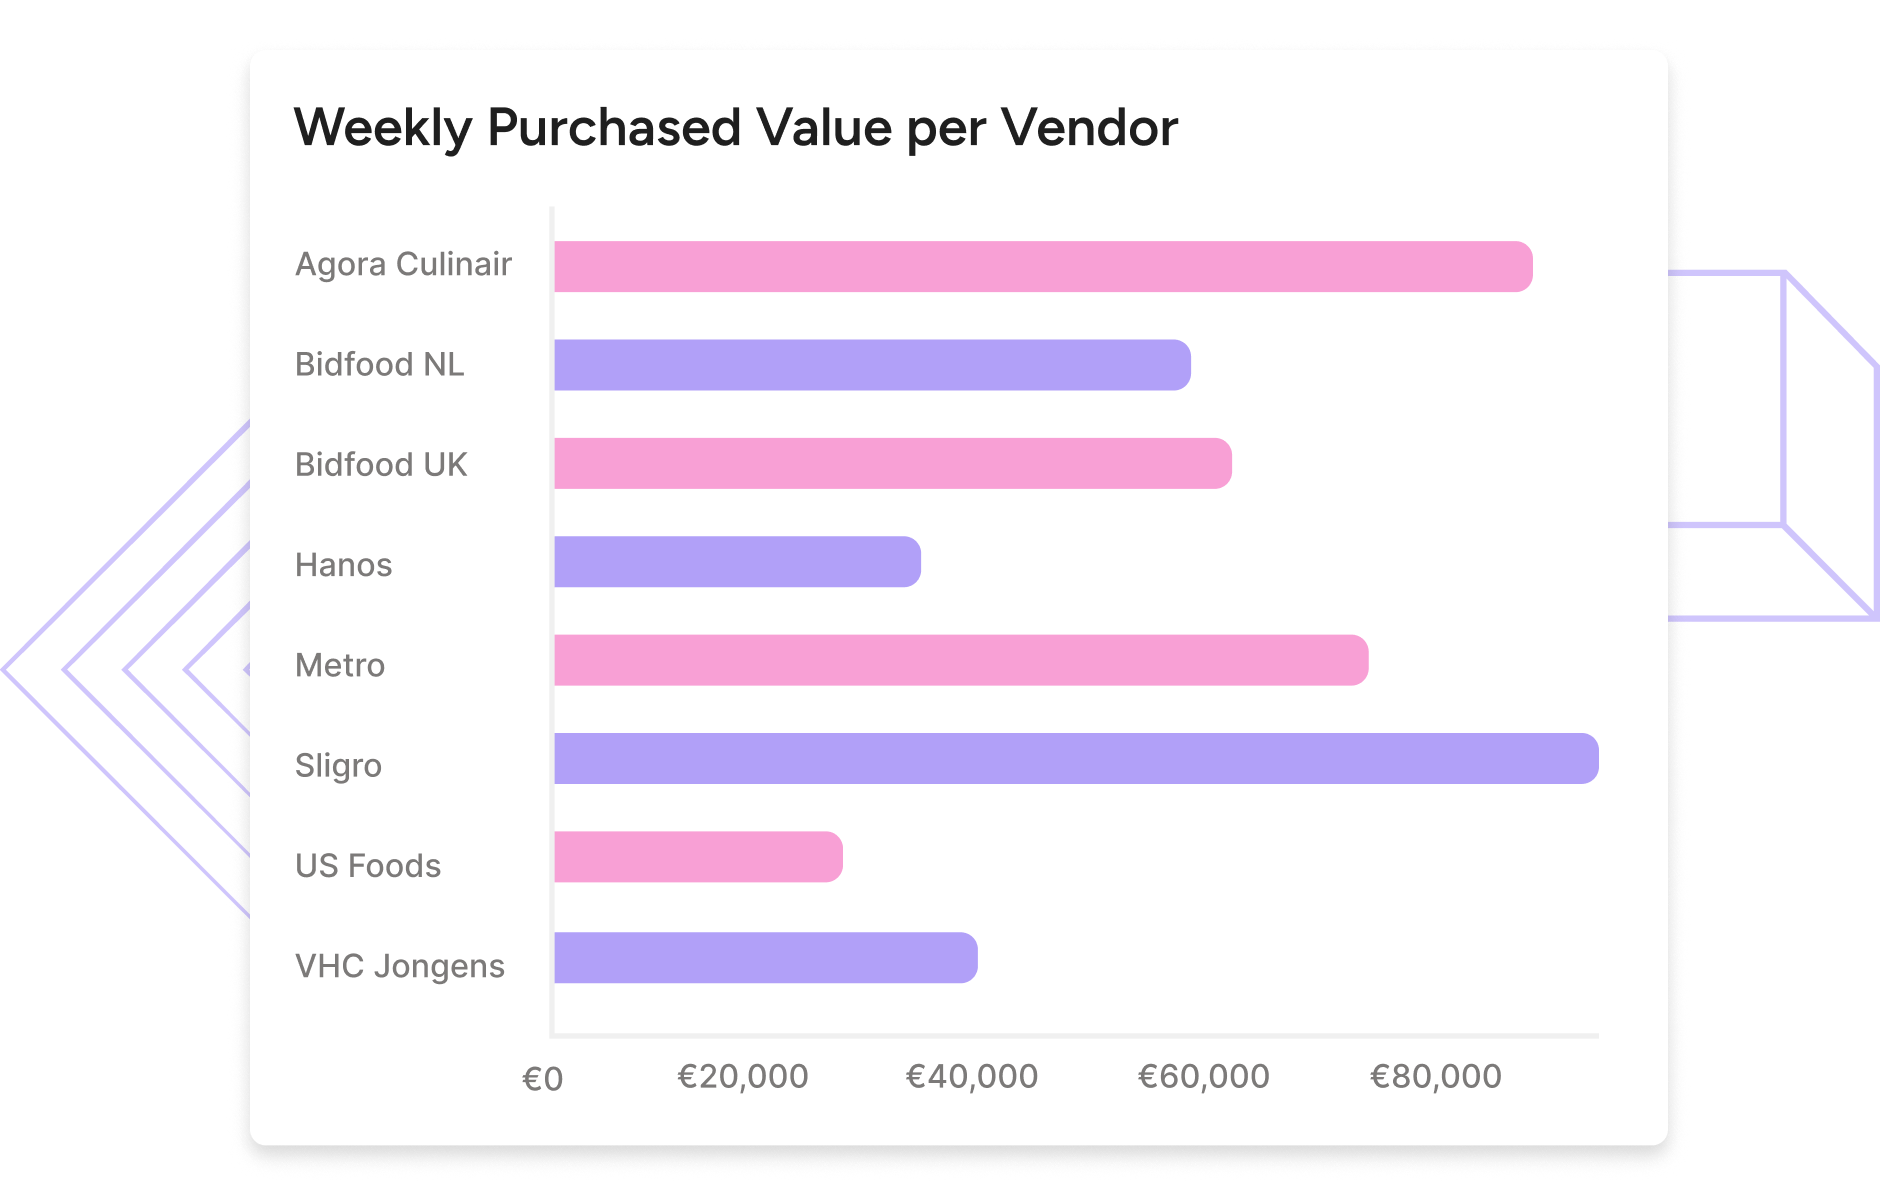
Track supplier behaviour and weekly delivery values with restaurant business analytics software. Use these insights to negotiate better deals and lower your theoretical (and actual) food costs. Keep control over CoGS at all times.
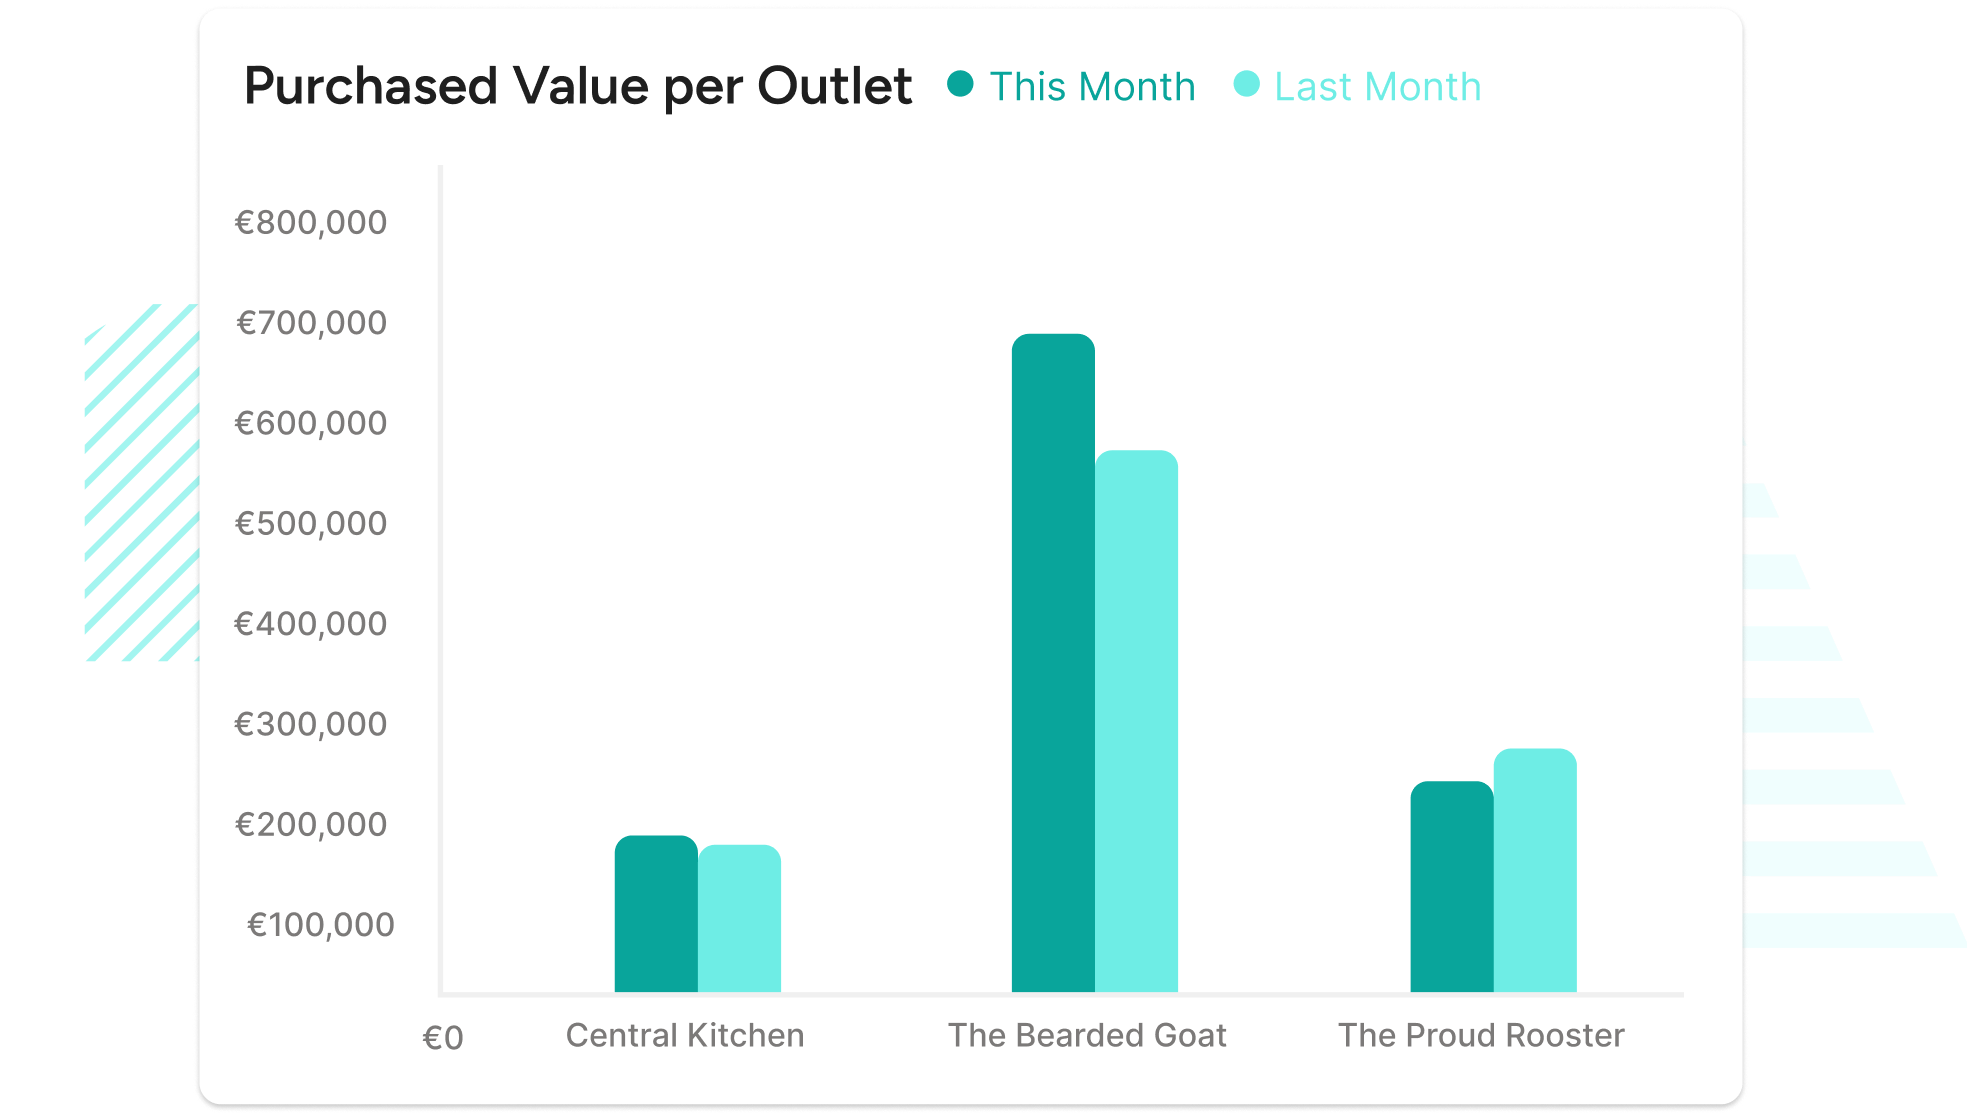
Monitor how much you spend with vendors at every location. Optimise deliveries to keep operational costs down.
Stop unauthorised purchasing
Identify ‘rogue’ spending location managers. Nip it in the bud. One less variance driver to worry about.
Focus on your best vendors
Find vendors with long-term potential. Build lasting partnerships. Secure optimal prices to drive growth.
Turn noisy data into clear visuals
Restaurant sales analytics dashboard
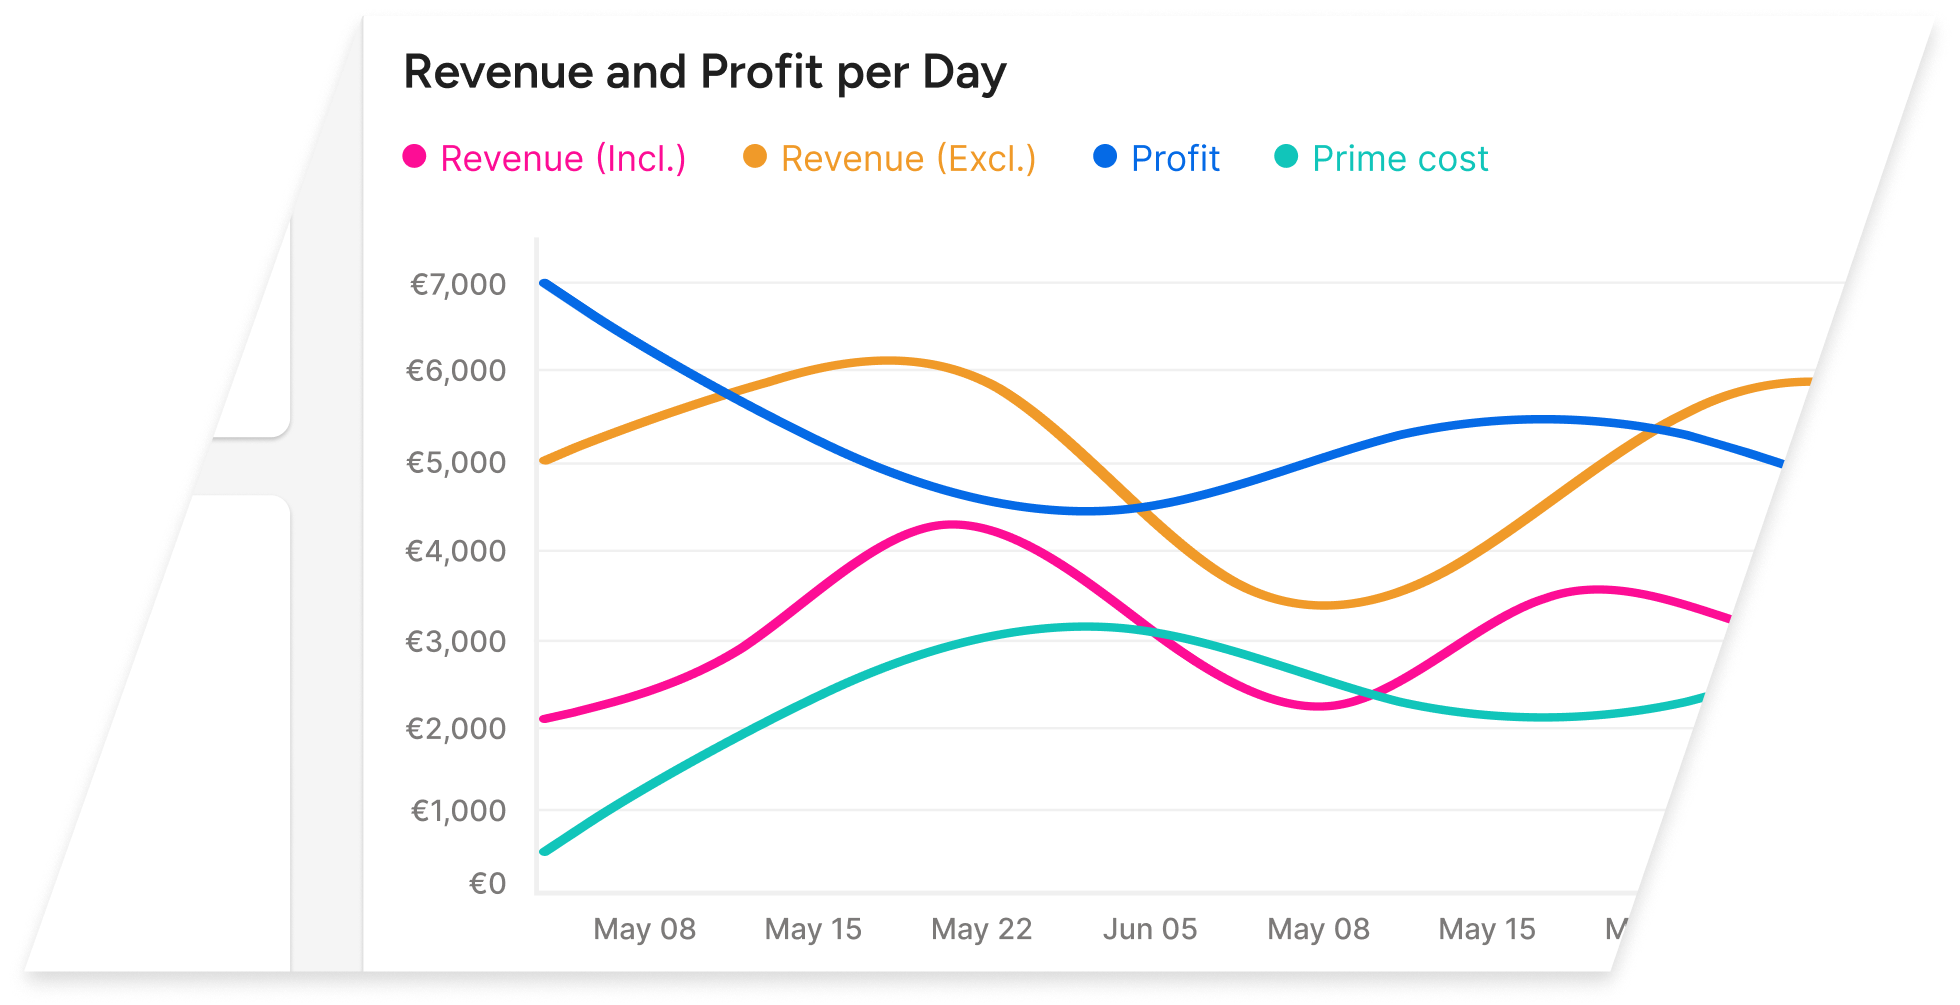
Make sales data work for you
Your PoS is full of profit-driving insights. The only problem? They’re buried in data. Our restaurant reporting software turns those insights into charts and graphs, giving you an overview of sales trends so you can continually improve your menus and offers.
Track the sales evolution of your menu items, and make budget, menu & promotion plans that maximise profit.
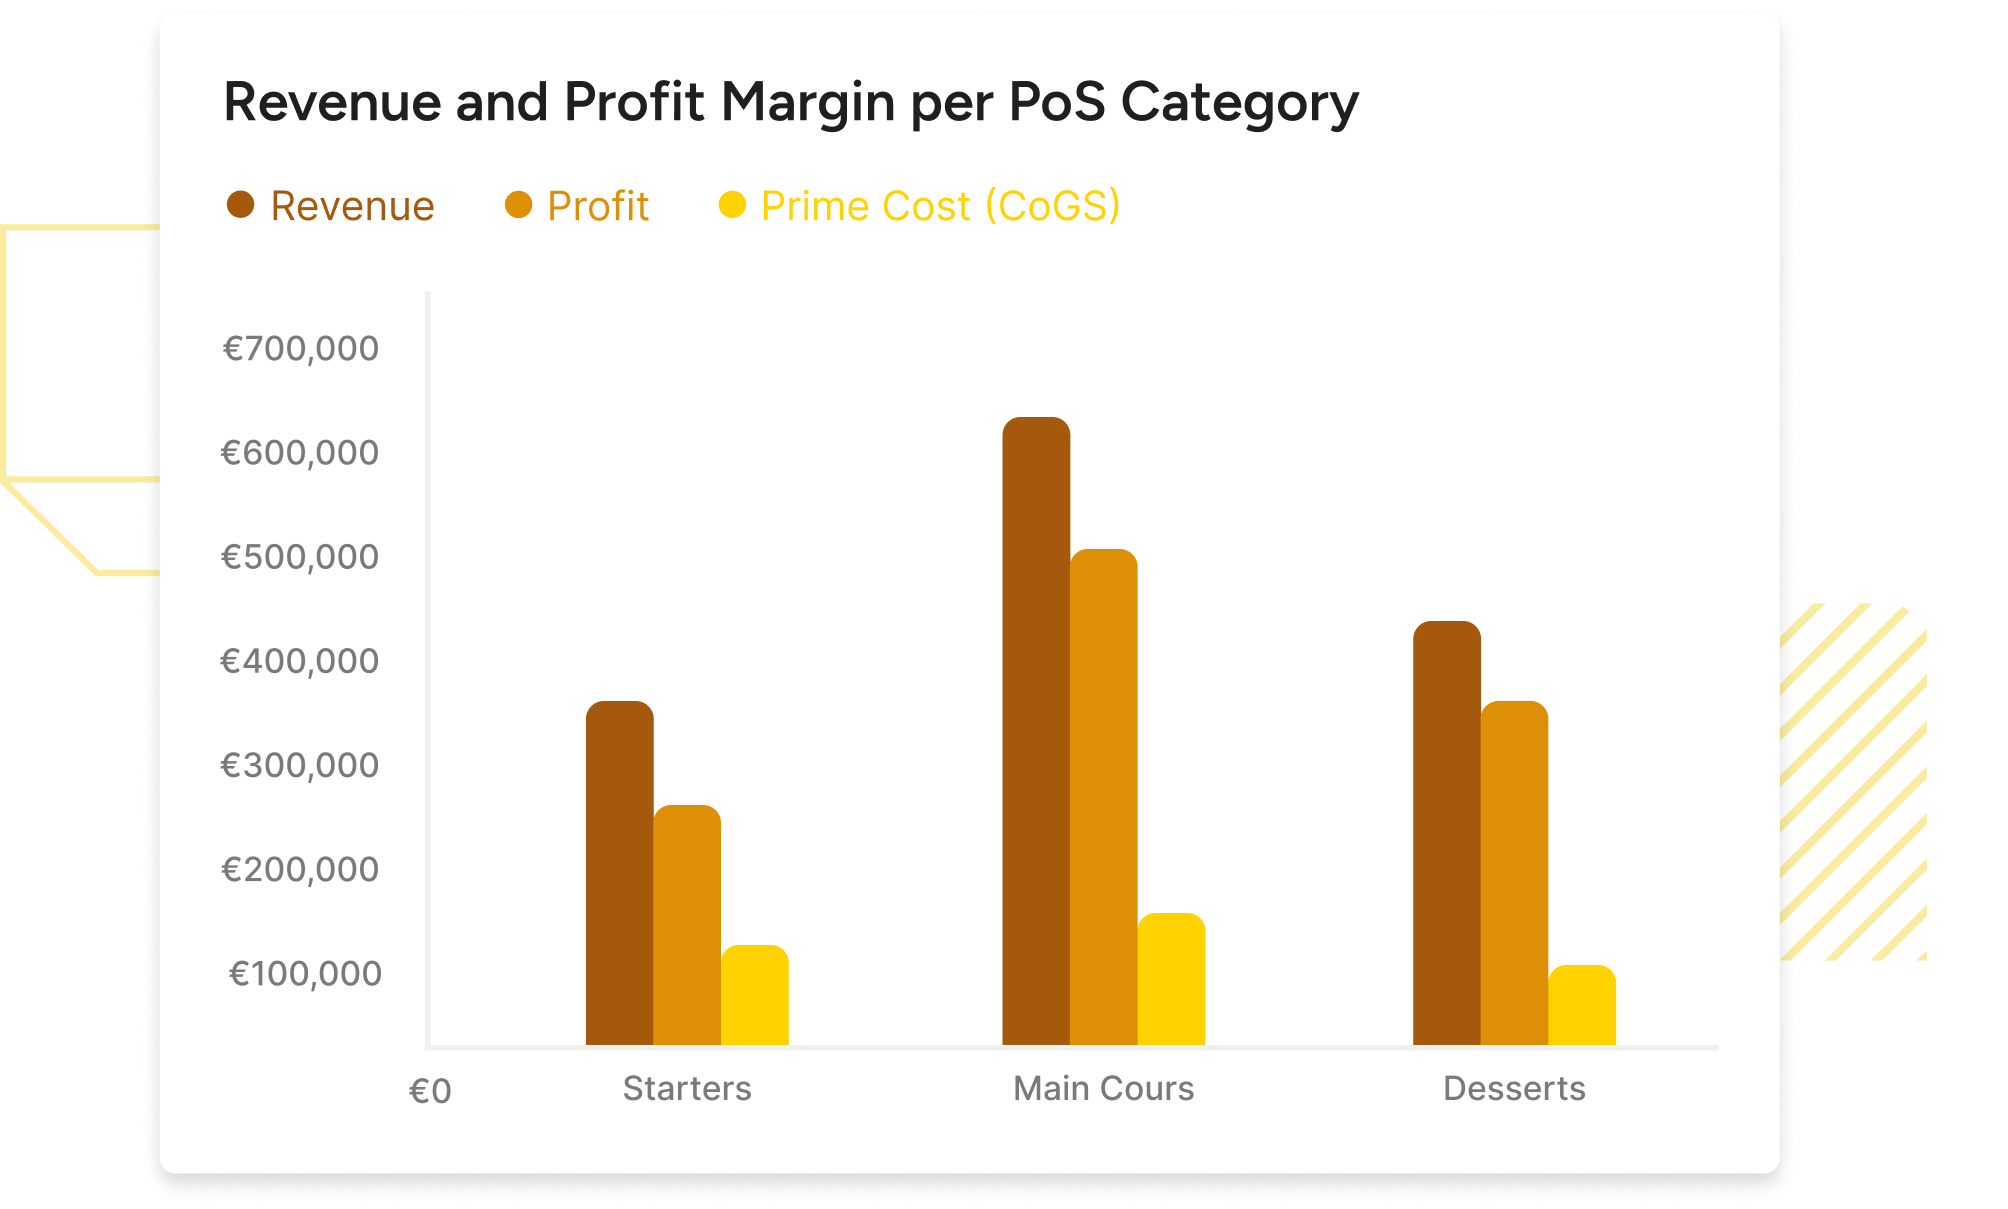
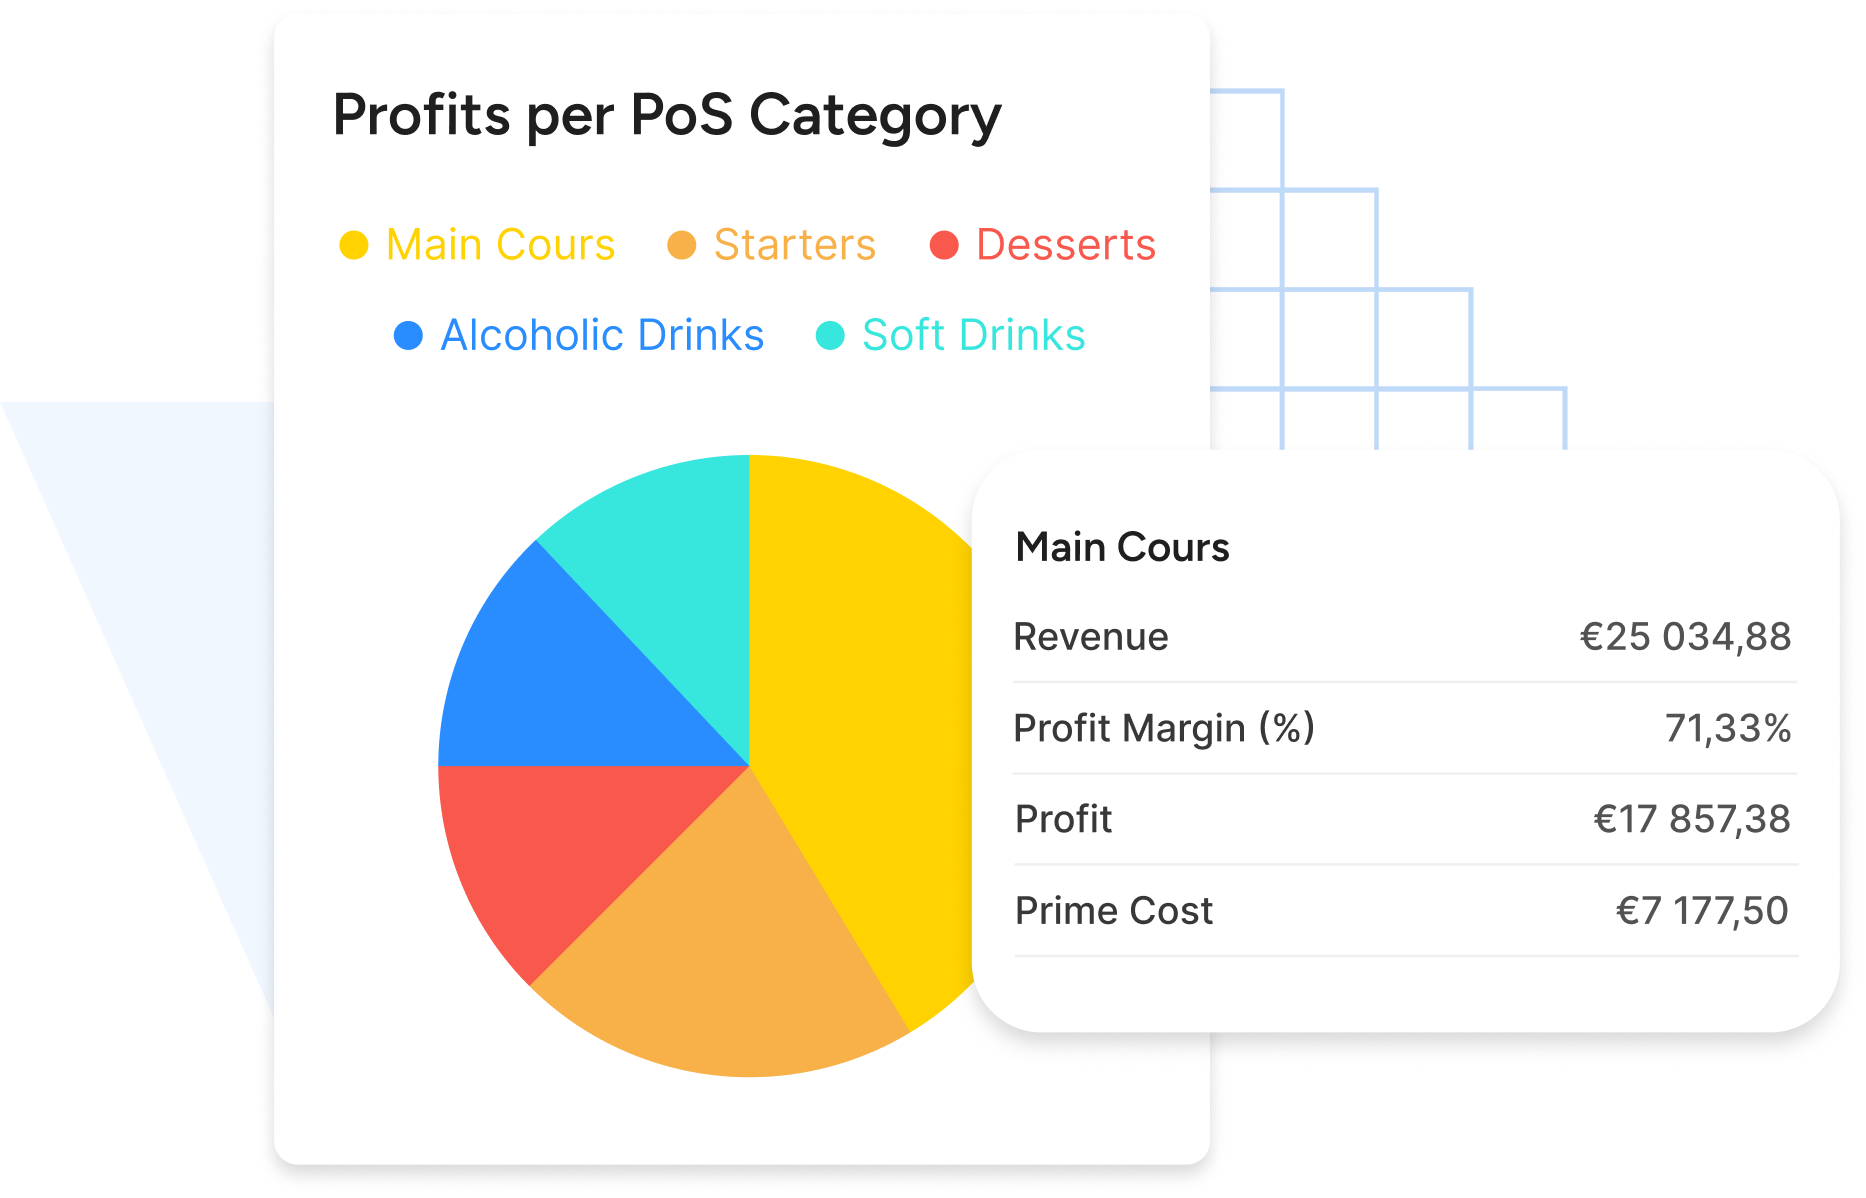
Dig into profit contribution per PoS category
Keep track of how each category in your restaurant POS system performs over time. That way, you can make the right decisions about removing, promoting, and adjusting recipes or prices.
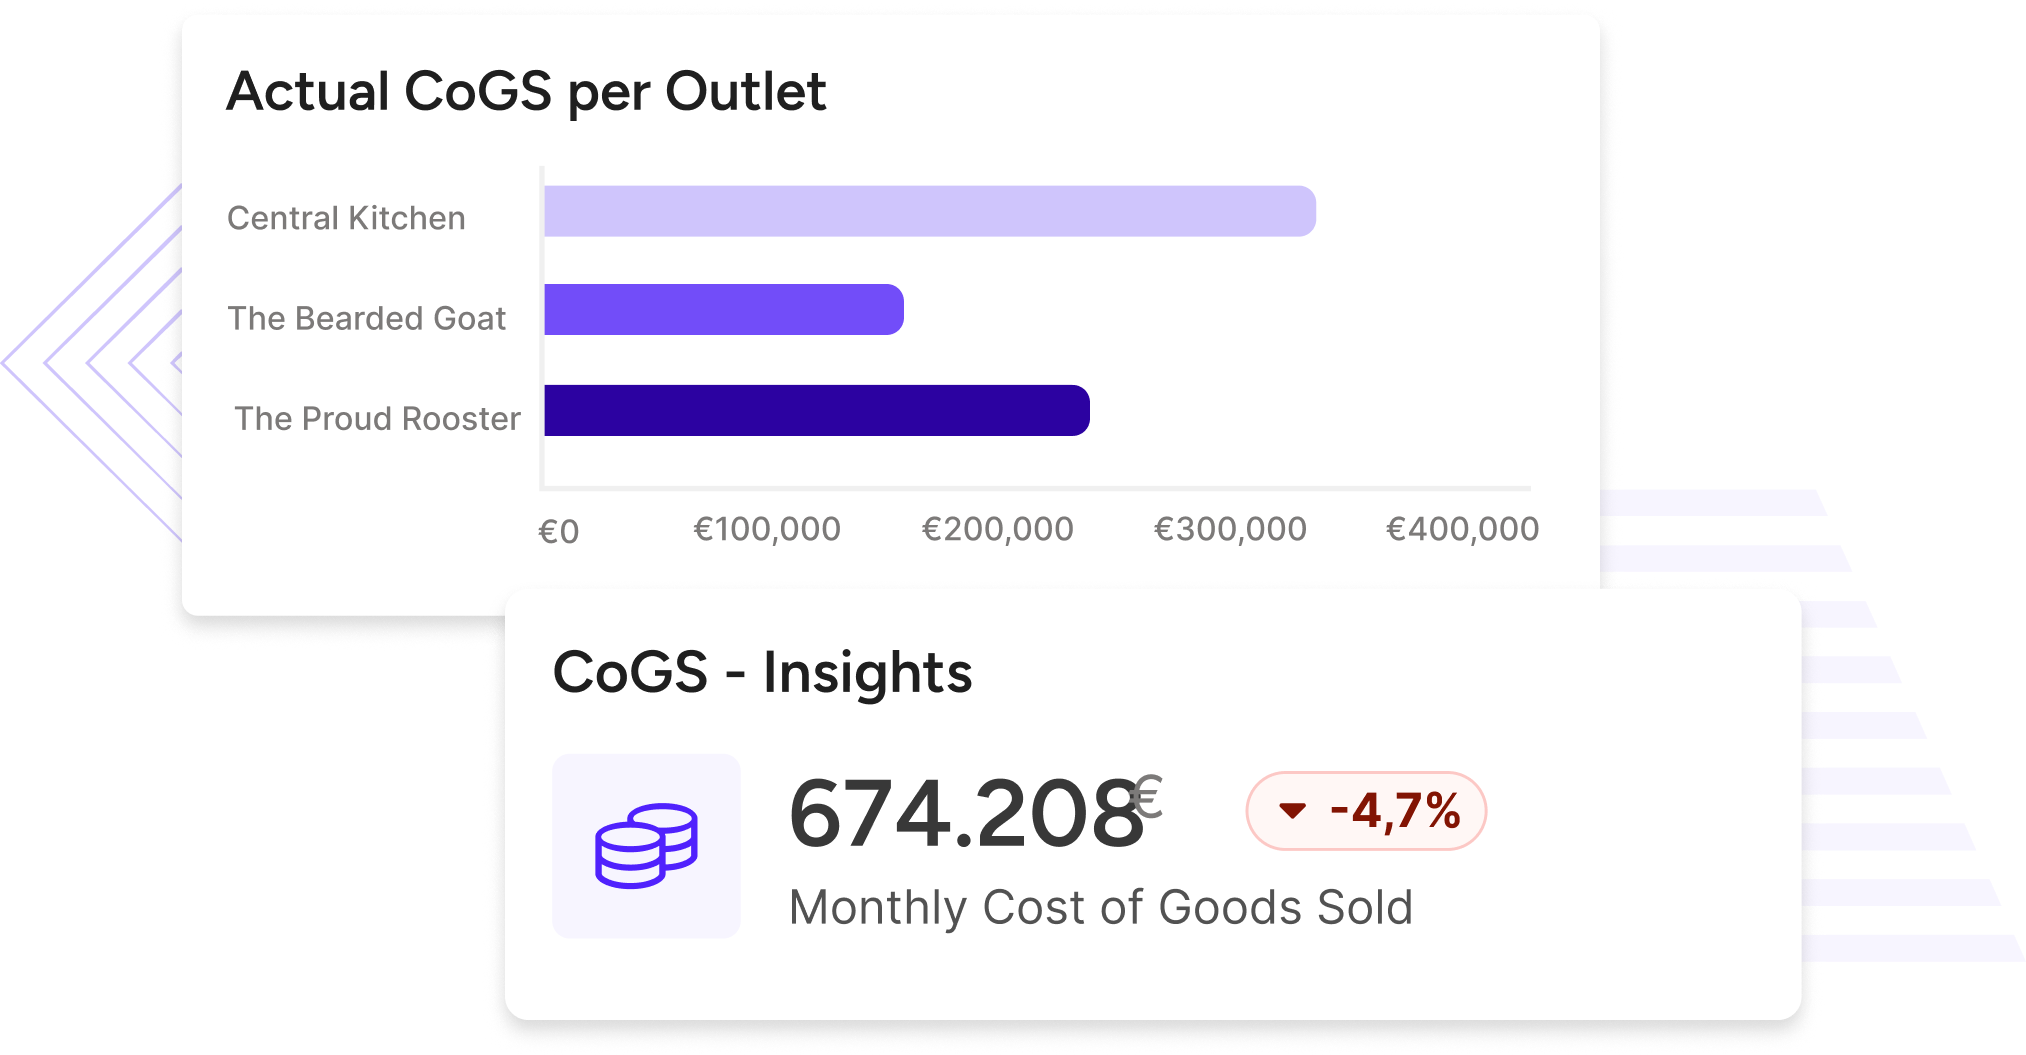
Stay on top of CoGS
Zoom in on cost-of-goods-sold per location to discover vendor & inventory discrepancies that are hurting your bottom line.
Get location-specific F&B insights through Apicbase
Spreadsheet busywork and data ambiguity impede business growth. Restaurant analytics dashboards help you scale your operations, reduce food costs, and increase profits.
From an HQ standpoint: Apicbase dashboards give us a quick & accurate overview of the goings-on in our restaurants at any moment. Since we’re growing fast, this visibility is essential. Plain & simple.
Jay Greenslade
The Avocado Show
Frequently asked questions
What key performance metrics can I track in Apicbase?
Apicbase is a platform that offers total control. The software analyses thousands of data points from your sales, inventory management, procurement, food costs, food waste and unit performance. The information is presented in clear dashboards that show evolutions and highlight discrepancies. You can drill down into the data to identify causes and opportunities for optimisation.
Tracked KPIs, amongst others, are:
Unit performance
Menu profitability
Food cost variance
Food cost percentage
Menu item profitability
Revenue and sales trends
Food and beverage costs (CoGS)
Inventory levels and usage per store
Supplier performance per store and company-wide
What insights does Apicbase generate?
Apicbase generates insights about every aspect of your business, focusing on F&B management and back of house operations.
Some specific insights you might find interesting are:
Most and least profitable menu items over time;
Inventory evolutions per unit;
Stock variance per item in a certain period;
The variance between the items ordered and received;
The causes of inventory variance;
Whether a dish is priced correctly;
Value of food waste during a specific period of time;
Types of food wasted, sorted by total value;
Total inventory value on any given day per unit and company-wide;
Deliveries per supplier, sorted by item value in time;
Deliveries per supplier during a specific period;
Most sold menu items;
Food cost variance per store and company-wide;
Profit margins per dish, category, menu and location;
Gross profit margin (Revenue – CoGS).
How much does Apicbase restaurant analytics software cost?
The cost of Apicbase restaurant analytics software varies depending on the plan and the specific needs of your restaurant, catering or dark kitchen operation. Here you can find the details of the plans and pricing structure.
Restaurant analytics software. Keep costs down and quality up