You must understand your key restaurant performance indicators (KPIs) to manage costs, improve margins, and drive growth effectively.
KPIs offer valuable insights into team performance, cash flow, and the overall success of your restaurant. Regularly monitoring these metrics lets you find opportunities to optimise performance, boost profitability, or prepare for potential investment. But with so many metrics available, which ones matter the most?
While front-of-house metrics like customer satisfaction often grab the spotlight, back-of-house metrics are foundational to your restaurant’s success.
This article explores essential metrics influencing process efficiency, cost control, and profitability. We will also guide you on how to track these metrics effectively.
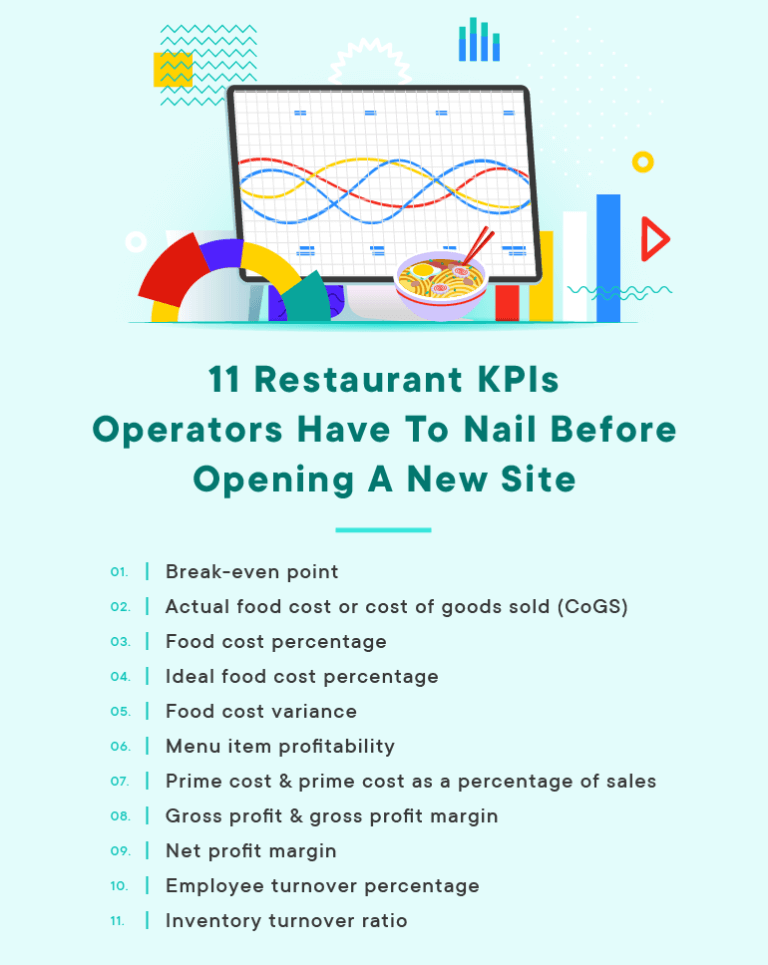
11 Restaurants KPIs To Focus On For Growth
Let’s examine key restaurant KPIs in detail.
1. Break-even point
The break-even point tells you exactly when your restaurant will generate enough revenue to cover all operating costs, helping you determine how long it will take for the business to become profitable.
Understanding the break-even point is essential for restaurant owners, especially when starting a new business or expanding to additional locations. They can use the break-even point to make informed financial decisions about new projects. It can also guide critical investments, like how much to spend on equipment.
For instance, if a high-end convection oven allows you to serve an extra 100 customers per service, the added revenue can quickly offset the initial cost. Tracking this metric helps ensure you’re making intelligent choices that contribute to the restaurant’s long-term success.
How to calculate the break-even point
Break Even Point = Total Fixed Costs / ( (Total Sales – Total Variable Costs) / Total Sales)

Automate Inventory Management
Bridge the gap between front and back of house with ease. Every sale in your POS system automatically reduces your stock by the exact raw ingredients. Know your inventory levels in real time.
2. Actual food cost or cost of goods sold (CoGS)
Actual food cost — or CoGS as it’s known more generally outside the restaurant industry — measures how much it costs to produce your food. It can also refer to the value of the stock currently held in your inventory at a specific point in time.
It helps you see how much it costs to prepare items for sale. It is a valuable restaurant KPI to assess your food costings and restaurant inventory management system, as it provides an accurate picture of your spending on food.
How to calculate actual food cost
For a given period of time, take the value of your inventory at the beginning of the period and add the value of new purchases. Then take away the value of inventory at the end of the period.
Actual Food Cost = Starting Inventory Value + Total Value of New Purchases – Ending Inventory Value.

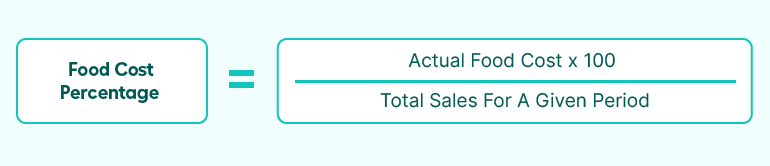
3. Food cost percentage
Once you know your actual food costs, you can calculate what percentage of your total sales they represent. This food cost percentage is a simple yet essential restaurant KPI that helps you gauge the profitability of your menu items.
The industry standard typically ranges between 28-32%, depending on the type of establishment (with cloud kitchens often cutting costs down to as low as 20%). This percentage provides a valuable comparison point, allowing you to see how each outlet performs in terms of cost efficiency.
How to calculate food cost percentage
To calculate the actual food cost percentage you divide the actual food cost by the turnover of the given period and multiply by 100.
4. Theoretical food cost percentage
The theoretical food cost is a target cost that helps you gauge performance. It is ‘theoretical’ in that it doesn’t consider over-portioning, trimmings, and other causes of food waste.
You can see how far you are from your target performance by comparing your theoretical food cost percentage to your actual food cost percentage. Examining the difference allows you to identify problems. It helps you pinpoint where to change menu pricing and how best to use menu engineering to improve your food cost percentage.
How to calculate theoretical food cost percentage
Calculate your theoretical food cost percentage using this formula:
Ideal Food Cost = (Total Food Sales / Total Cost of Ingredients Used) × 100

5. Food cost variance
Food cost variance is the #1 restaurant KPI for back-of-house ops. By comparing your food cost percentage with your ideal food cost percentage, you get your food cost variance. Say your ideal food cost percentage is 28% but your actual food cost percentage is 32%. The food cost variance of 4% is your room for improvement.
An estimated 11.4 million tonnes of food is wasted by the US restaurant industry every year. For restaurants, this represents a huge opportunity not only to waste less for environmental reasons, but to stop wasting money on food that goes in the bin.
To ensure profitability, it’s crucial to know what proportion of your inventory is lost due to pilferage, squandering, inconsistent portion control or any other causes.
There are seven common causes of food cost variance:
- Waste or squandering: Food is unnecessarily discarded or used inefficiently
- Incorrect portion size: Serving sizes are inconsistent
- Poor order reception procedure: Missing or spoiled items are not returned for a refund
- Theft: Food or ingredients are stolen by staff or others
- Unrecorded sales: Sales are made but not documented, affecting inventory tracking
- Accounting errors: Mistakes in bookkeeping or data entry lead to discrepancies
- Modified ideal food cost: Changes or mistakes in the expected food cost model skew budget tracking
These are the areas in which you can make up the margin to bring your food cost percentage as close as possible to the target.
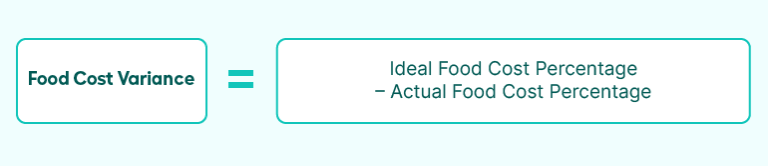
How to calculate food cost variance
Food Cost Variance = Ideal Food Cost Percentage – Actual Food Cost Percentage
6. Menu item profitability
Working out individual menu item profitability is crucial for effective menu engineering. Restaurateurs always know the most popular dish, but do they actually know which ones are making them the most money?
Working out each item’s profitability takes away the guesswork and biases and shows you the real numbers to pinpoint your most profitable dishes.
Similar to the food cost percentage, it shows you your best-performing dishes. This allows you to compare dishes and make informed decisions about pricing, special offers, and availability.
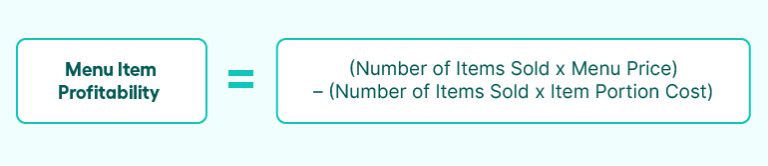
How to calculate menu item profitability
To calculate menu item profitability, you need the item portion cost. First, list all the ingredients of the menu item. Then measure the amount of each ingredient used to make one portion. Then use the cost of the ingredient to determine the cost for each portion and sum up the total for all ingredients used.
Menu Item Profitability = (Number of Items Sold x Menu Price) – (Number of Items Sold x Item Portion Cost)
7. Prime cost & prime cost as a percentage of sales
The prime cost is a measure of almost all of a restaurant’s controllable costs – the total labour costs together with the actual food cost (or CoGS). The labour cost includes all salaries, hourly wages, staff expenses and benefits.
This total serves as a benchmark for a restaurant’s control over its costs. It is also a useful metric to use in further calculations. Typically, prime cost should be no more than 60% of total sales. If it goes higher than this, you should investigate why.
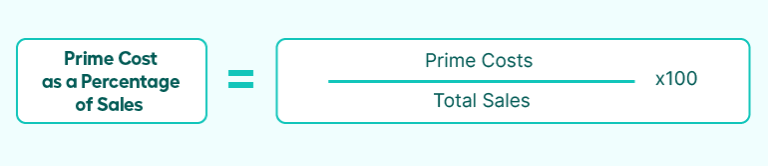
How to calculate prime cost & prime cost as a percentage of sales
Prime Cost = Total Labour Costs + CoGS

Prime Cost as a Percentage of Sales = Prime Costs / Total Sales
8. Gross profit & gross profit margin
Gross profit is one of the most fundamental key restaurant performance indicators. It shows how much the business is earning before accounting for fixed costs and therefore provides a high-level overview of the business’s financial health.
If your gross profit is lower than expected, or inconsistent with industry standards of around 70%, it’s a signal that something in your pricing, cost of goods, or sales volume needs to be addressed. You’ll want to identify and fix the underlying issue—whether it’s high production costs, inefficient operations, or pricing strategy—before focusing on other financial metrics.
The gross profit margin, expressed as a percentage of total revenue, is another useful metric. It serves as a benchmark for measuring the efficiency and profitability of the business.
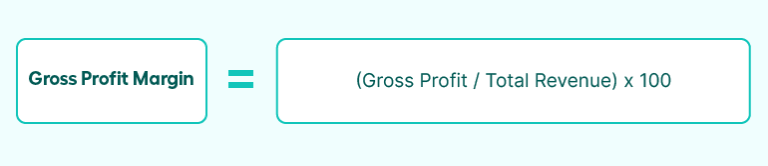
How to calculate gross profit & gross profit margin
Gross Profit = Total Revenue – Actual Food Cost

Gross Profit Margin = (Gross Profit / Total Revenue) x 100
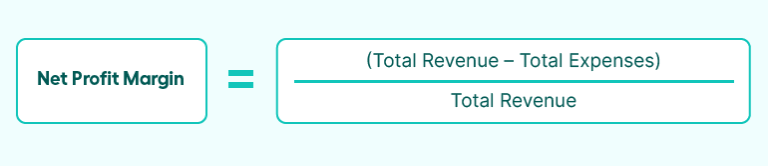
9. Net profit margin
The net profit margin tells you how much profit the business is making after all expenses have been deducted, including operating expenses, taxes, and interest. This metric helps finance managers understand how much cash is available for reinvestment or growth.
On the other hand, the gross profit margin focuses on profitability at an earlier stage. It shows how much profit remains after accounting for the cost of goods sold (COGS), but before deducting other operating expenses. Gross profit margin is a useful metric for evaluating production efficiency and the direct costs of your products or services.
By comparing gross profit margin and net profit margin, you can gain deeper insights into both your cost structure and overall financial performance.
How to calculate net profit margin
Take your total expenses and divide by your total revenue.
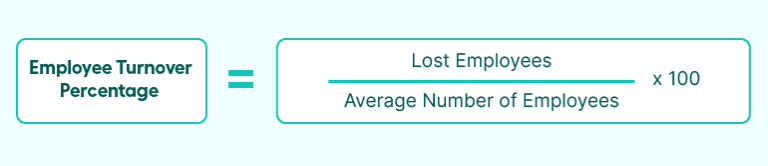
10. Employee turnover percentage
Employee turnover is a measure of how many employees leave or are fired and need to be replaced in a given period. The ratio gives this as a proportion of the total number of employees.
The restaurant industry has a particularly high turnover rate, as much as 30% more than other sectors. Finding and training new staff is a huge cost in the industry but also a burden on efficiency and on existing staff.
It’s much more efficient to keep trained staff than to have to find, vet, onboard and train new staff constantly. Managers who can keep this ratio low deserve a medal. It’s one of the toughest jobs going. That is why it is so important to keep a close eye on this restaurant KPI.
How to calculate employee turnover ratio
First, calculate the average number of employees using this formula:
Average Number of Employees = (Starting Employees + Ending Employees) / 2
Reduce food costs & maximise profits: These are the restaurant inventory metrics multi-unit operators need to track.
11. Inventory turnover ratio
The inventory turnover ratio shows you how often your total inventory is used and replaced. It is important to know this in order to avoid over or under-stocking your shelves. This helps to reduce food waste and avoid having too much cash tied up in stock. And also to avoid running out of items and disappointing customers.
How to calculate inventory turnover ratio
First, calculate the average inventory with this formula:
Average Inventory = (Beginning Inventory + Ending Inventory) / 2

Restaurant KPIs to Scale Your Restaurant Business Confidently
If you want to expand your organization and open new sites, it’s essential to have a thorough understanding of your costs, ensure consistency across locations, and identify ways to improve operations. This requires digging into your KPIs and using data effectively.
When data is siloed in different departments or locked in spreadsheets, making informed decisions can be challenging. KPIs critical for validating investments or securing financial backing can quickly become unreliable if calculations are inaccurate or data is missing.
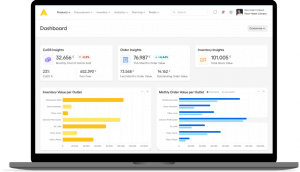
Apicbase is a centralized system designed to streamline your data management. As you add new units, you can connect them to Apicbase to track your restaurant KPIs.
The software updates all your restaurant data in real time and automatically calculates essential KPIs, providing you with an instant health check of your business and individual outlets from anywhere.

Ready to Optimise Your Operations? See Apicbase in Action!
Major restaurant groups, ghost kitchens, and international restaurant brands use Apicbase daily to manage inventory, control costs and wastage, and inform operational decisions.