
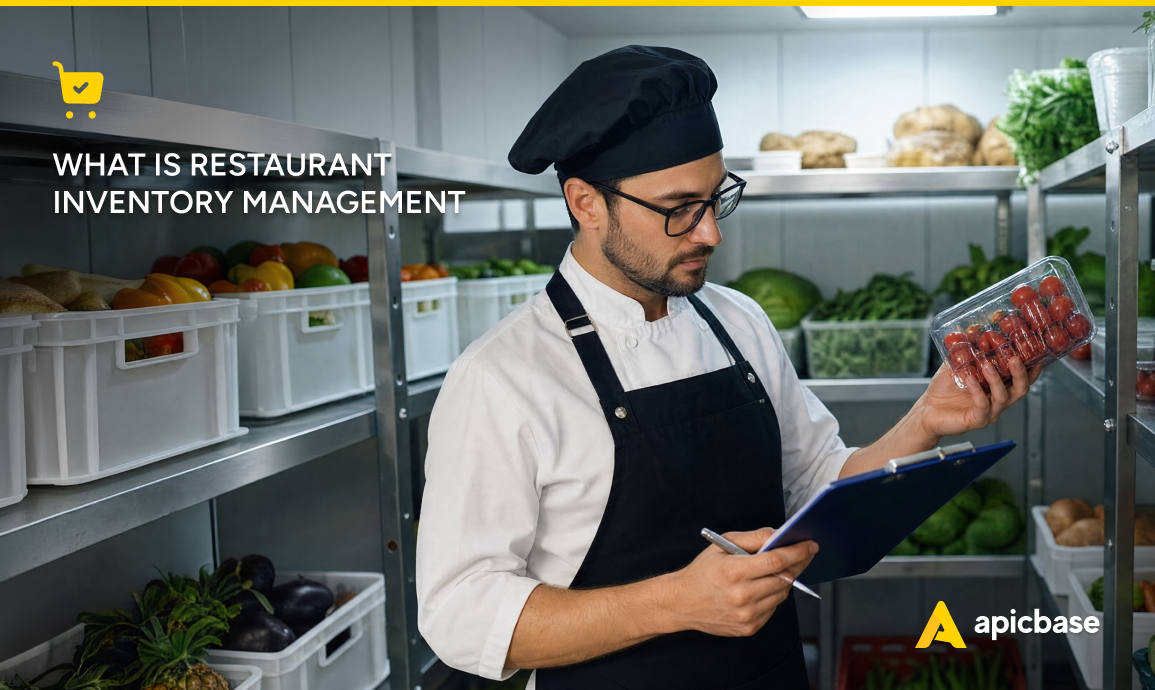
Restaurant inventory management is the process of tracking the food, drinks, and supplies that move through your kitchens. It tells you what you have, what you’re spending, and where you’re losing margin.
At a single location, inventory management usually involves counting stock on a regular schedule, setting par levels, and verifying that inventory usage matches sales.
For multi-site restaurant operators, the real challenge is consistency. If each location counts items differently, uses different units, or follows different stock procedures, you can’t compare results. Group-level reporting becomes unreliable, and it’s harder to spot problems.
This guide explains how inventory management works across multiple restaurant locations. You’ll learn how it affects food cost and inventory variance, and how data and AI can help you improve consistency and protect profit margins across your business.
Inventory management as a cost‑control discipline
Restaurant inventory management gives you a clear view of how money moves through your kitchens.
It tracks what each site orders from suppliers, how much stock it uses, and what it should have on hand.
Inventory falls into three categories: food, beverages, and supplies. Food includes everything from proteins to dry goods. Beverages cover the bar and cellar, where losses add up quickly. Supplies include packaging, cleaning products, and other consumables. Each category needs to be counted, valued, and reordered on a regular schedule.
The goal is food cost control: Are your kitchens using inventory the way your recipes and sales data say they should?
Peter Schimpl, VP of Digital & IT at 200+ restaurant group L’Osteria, explains it best: “Inventory management helps us to generate data, data points we can measure. It gives us certainty.”
Stock control doesn’t scale by doing the same thing harder
Managing inventory for one restaurant is very different from managing a 500-store operation.
- At one site, inventory can be managed on paper or in Excel. One manager counts the storeroom, updates the sheet, and orders back to par. The system is imperfect, but it works because one person holds all the context in their head.
- By five to ten locations, the cracks start to show. Sites start to adapt item names, units, and par levels to fit their own habits. Local suppliers, stock transfers, and slightly different menus creep in. These are small differences on the ground, but they become serious inconsistencies the moment you try to roll up food costs across the group.
- At twenty-plus locations, no single person can hold enough context to catch every inconsistency across twenty kitchens. The fix has to live in the system, not in someone’s head. If not, you get twenty versions of the truth, none of which line up. Head office can’t trust the numbers. Finance can’t reconcile Cost of Goods Sold (COGS), and procurement has to estimate actual stock levels and product-level variance.
- At 100 locations, running inventory on spreadsheets is like trying to run payroll in a notebook. Every new site adds to the chaos: counting errors, unit mismatches, undocumented transfers, and recipes that drift from the standard.
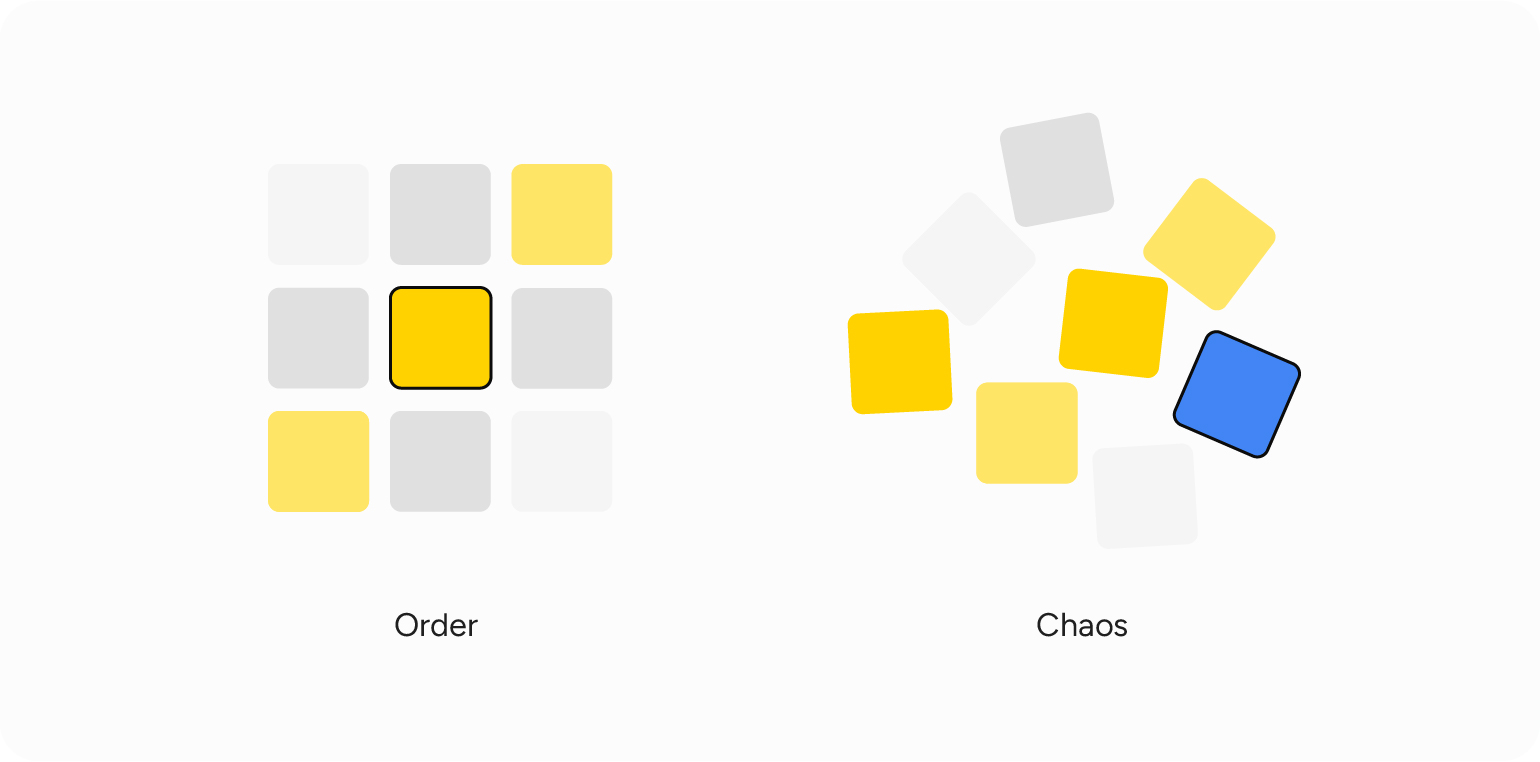
At this scale, the only way to stay in control of purchasing, inventory, and food costs is to centralise inventory management. With Apicbase, every location follows the same products, suppliers, recipes, purchasing process, and stock-counting method. Everyone works from the same source of truth.
How do you manage inventory in a restaurant, step by step?
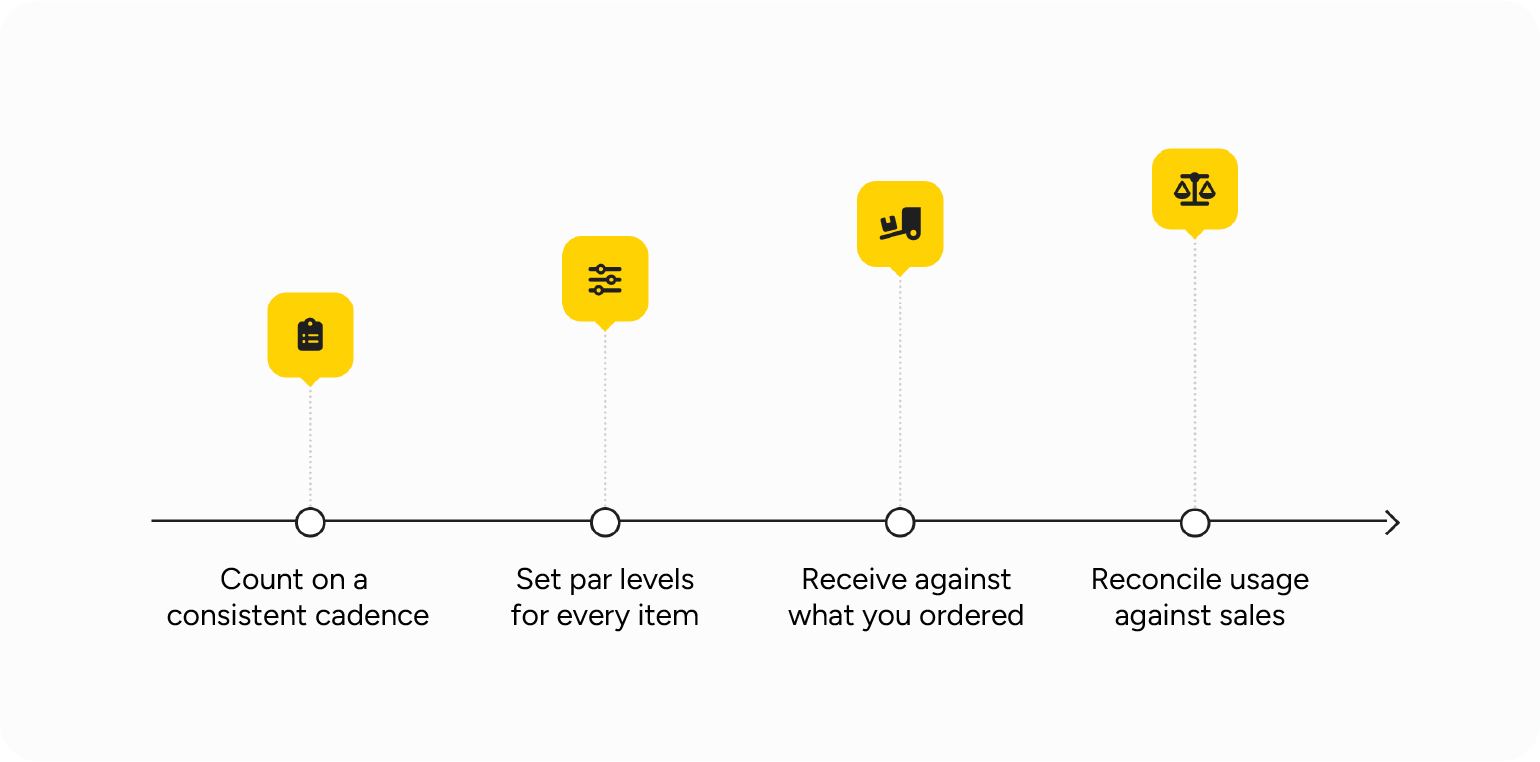
Managing inventory comes down to four recurring steps: count on a fixed cadence, decide how much to reorder, receive against what you ordered, and reconcile usage with sales. The discipline is in doing all four consistently, not in any one of them.
1. Count on a consistent cadence
Start with the count. Pick a cadence and hold to it: high-value or fast-moving items (proteins, the bar) weekly or even daily, the long tail monthly. Just as important as the cadence is the discipline of doing it the same way every time, by the same method, in the same order.
The reality is that most restaurants count far less often than the textbooks suggest. Apicbase data from thousands of sites put the median at around 13 counts per year. That’s roughly once a month. About 20% of operators count stock, at least partially, every week.
Inconsistent counting is worse than counting less often because, when numbers mean different things to different people, trends or patterns that might surface become meaningless.
For example, in week 1, a bartender counts spirits in partial bottles (“about half a bottle”), the kitchen counts steaks in trays, and no one counts the backup dry storage. In week 2, a new manager counts spirits in millilitres, steaks in individual portions, and includes dry storage. On paper, it will look like a huge spike in usage or a shrink, but in reality, the counting method simply changed; the “trend” is meaningless. The ‘same’ number means something different every time it’s recorded.
2. Set par levels for every item
A par level is the target amount of an inventory item you need on hand to meet expected demand without overstocking. When stock drops below par, you reorder to bring it back up to par.
Getting par right means accounting for four things: usage rate, lead time, safety stock, and delivery frequency. We cover the method in our guide on how to set par levels.
The goal is to keep what’s on the shelf as close as possible to what you’ll actually use. For sites with steady, predictable demand, par levels are an efficient way to do that. They help on-site staff decide how much to reorder.
Great as they are, there is a catch. Par levels can vary widely by location, so someone at each site needs to know the operation well enough to set them correctly and be disciplined enough to keep them up to date. That’s not always the case.
And because the responsibility sits with local staff, the head office is often left guessing. As one operator told us: “I don’t have a say or control at the moment on the par levels. That’s the chef’s territory. I can’t know if they are way above par or under.” If you can’t see par, you can’t control F&B spending.
Apicbase data shows 79% use more advanced methods. The lack of visibility is why multi-site restaurant operators are moving away from static par levels for stock replenishment.
Contract caterers tend to order via the bill of materials and menu-planning features of Apicbase, while multi-site restaurants increasingly use its sales-based ordering and demand forecasting.
3. Receive against what you ordered
The next step is straightforward: match the delivery note to the purchase order, and check the invoice against both.
In our experience, unchecked deliveries are where margin slips away unnoticed. Wrong quantities, short deliveries, supplier price increases, it all slips through here. A good receiving process catches these problems at the door. The alternative is discovering them in your P&L weeks later, by which point the trail has gone cold and finding the cause is nearly impossible.
4. Reconcile usage against sales
The final step at the end of each period is to compare what you actually used (from your stock counts) with what you should have used (from your recipes and POS sales).
That gap is called stock variance. It’s the single most useful number your inventory process produces. A small variance is normal. A large one tells you something is wrong. The bigger the gap, the more your food costs are inflated, and the harder it hits your margins.
What are the best ways to count stock?
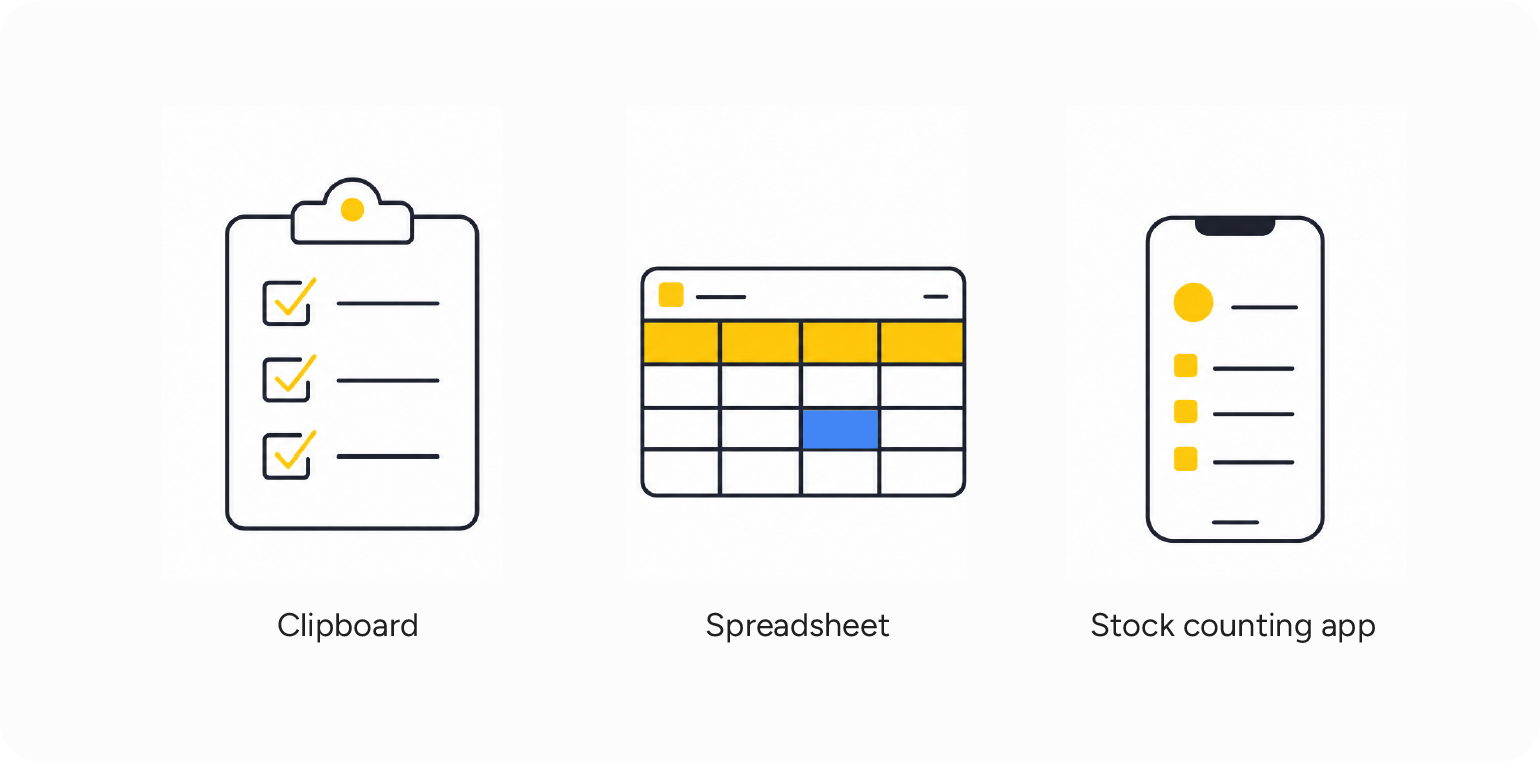
The best stock counting method is the one your team will actually stick with. Accuracy matters, but consistency matters more.
| Method | Setup | Speed | Scales across sites? |
|---|---|---|---|
| Clipboard | None | Slow, error-prone | No — data stays with whoever counts |
| Spreadsheet | Low | Manual | No — every site keeps its own version |
| Inventory app | Moderate | Fastest, counts feed the system | Yes — one central, comparable record |
Clipboard
The clipboard is universal because it needs nothing. Pen and paper require zero setup, but it’s slow and error-prone, and the data never leaves the person holding the clipboard.
Spreadsheets
The spreadsheet is the workhorse most restaurants use. There’s a reason chefs are constantly searching Google for free inventory templates.
For a single site, a well-built Excel spreadsheet works. The trouble starts when you try to scale spreadsheets. They don’t connect to your sales or recipes. Every location keeps its own version. Consolidating 10 sites into a single view requires a manual copy-paste job that introduces new errors every time.
We know the love for spreadsheets runs deep in hospitality, even at groups running ten or more sites. But those same operators also need a single source of truth with connected data. That’s why the Apicbase app offers photo counting. Staff do the count on a printed spreadsheet and take a photo with the app. Apicbase reads it and puts everything in the system.
Restaurant inventory app
A stock-taking app, like the one from Apicbase, is the most advanced way to count stock. It’s also the one general managers (GM) tend to prefer. The reason is speed.
A count takes a fraction of the time when all chefs have to do is scan barcodes with their phones, and the numbers feed straight into the system instead of into an Excel file that someone has to retype later.
When stock takes are fast and easy, they get done more often. And regular counts are what make the inventory numbers reliable.
When people trust the method, they trust the reports; if not, they revert to a spreadsheet “just to be safe”, and inventory remains a black box. Fast, accurate stock-counting methods are what break the cycle.
How does inventory connect to food cost?
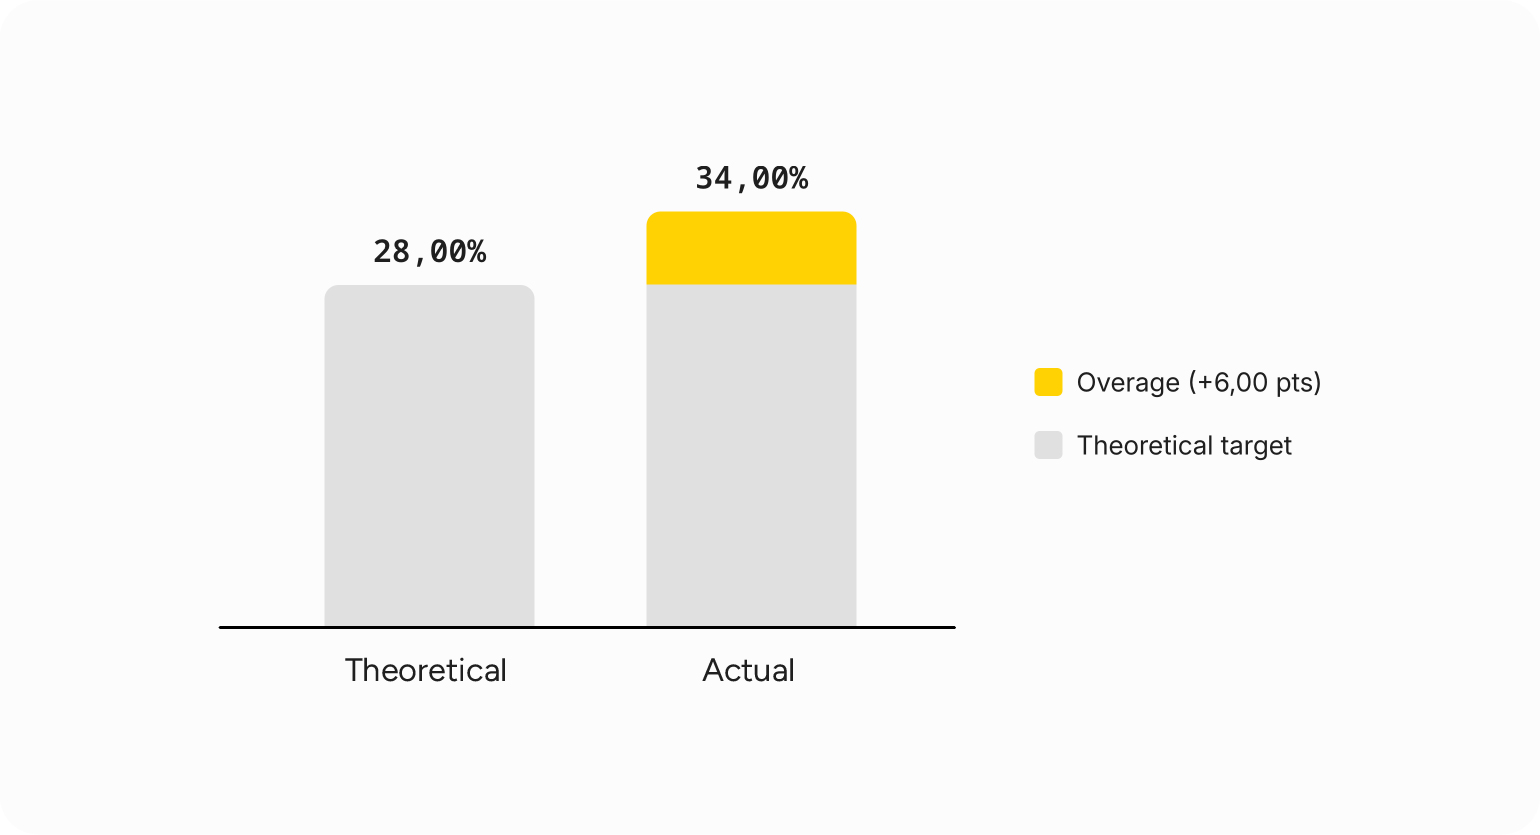
Inventory management provides the input to your most important cost metric, actual food cost. If the counts are wrong or a POS integration is missing, everything downstream loses value or even becomes meaningless.
The mechanism that ties inventory to food cost is the variance loop. Your recipes and POS sales tell you your theoretical food cost. This is what you should have spent, given what you sold. Your physical counts tell you your actual food cost. This is what you really spent.
The gap between theoretical and actual food cost is called food cost variance. It’s an indicator of how much over-portioning, waste, shrinkage, and supplier price increases eat into restaurant profit margins. For the full mechanics, see our guide to theoretical vs actual food cost.
Many well-run multi-site operations aim to keep variance under 3%. They treat inventory as a cost-control discipline rather than a simple stocktake to “give finance a number.” It’s also one of the most direct ways to reduce food cost without touching portion sizes or renegotiating supplier contracts.
A 3% variance is the exception. Most restaurants are nowhere near it.
Apicbase data show that the median restaurant runs a food cost 6 to 9 points above what its recipes and sales suggest it should be. A site that thinks it’s running at 22% can easily be running at 30%. On a €5M revenue base, that 6-point gap is €300,000 a year that never reaches the bottom line.
And without a proper inventory management process, they won’t even realise they are losing profit margin.
How is AI changing restaurant inventory management?
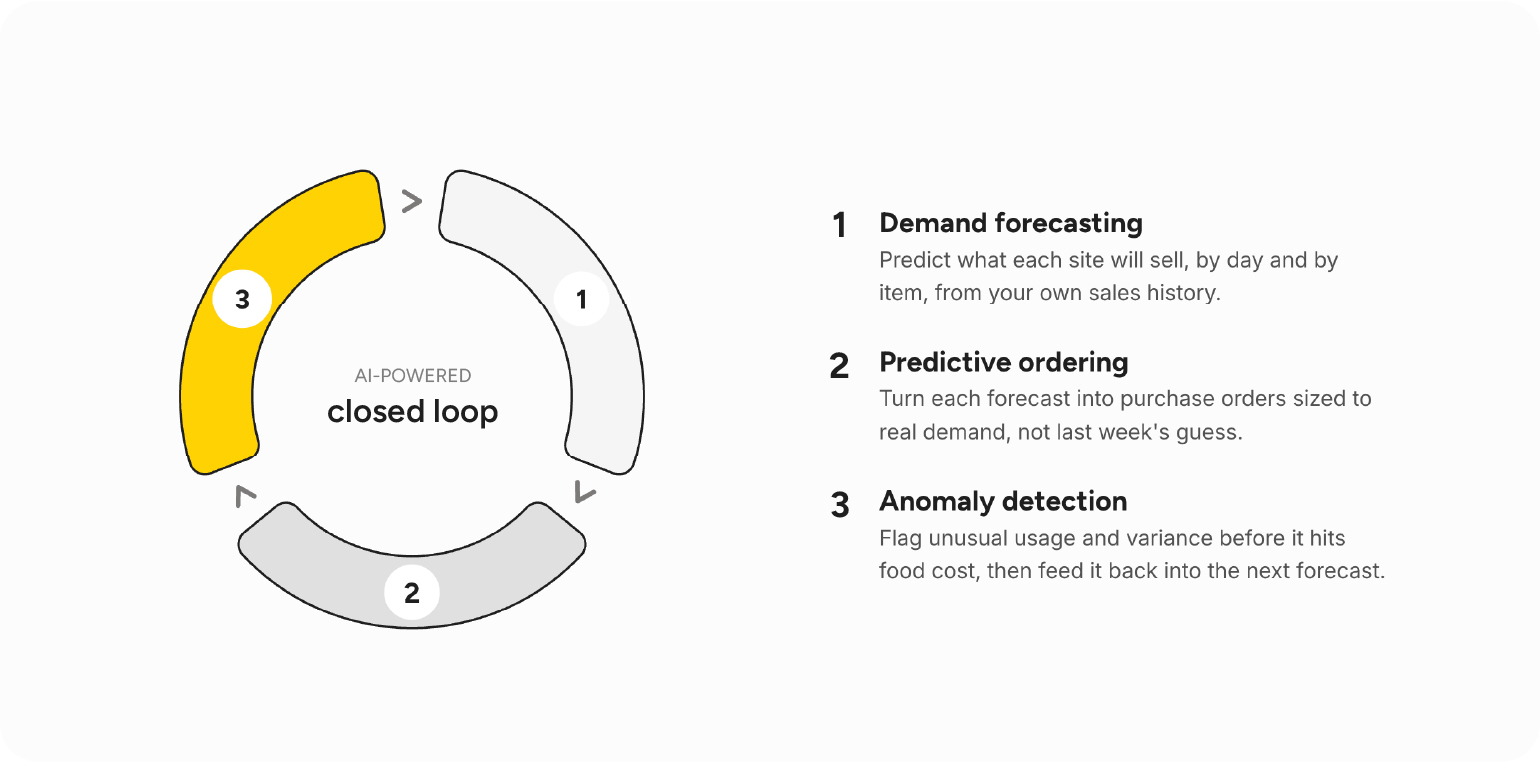
AI is changing three parts of the job: demand forecasting, predictive ordering, and anomaly detection.
Demand forecasting
Demand forecasting pulls in past sales, seasonal trends, and historical patterns to project what each site will actually sell, so your par levels reflect reality rather than a fixed number.
It’s a useful capability, but it has its limits. A brand-new site has no sales history. There’s nothing for the model to learn from. A sudden heatwave or a major local event will break the pattern the AI has been following. And if your underlying sales data is messy — gaps, duplicates, miscategorised items — the forecast will be messy too.
Predictive ordering
Predictive ordering takes that forecast and turns it into a draft purchase order with the right quantities for each site and supplier, ready for a human to review and approve. The value is that it removes the per-site guesswork that causes one location to overorder while another runs out of stock.
Predictive ordering needs supplier lead times and pack sizes in the system to work. Without them, it will suggest orders that won’t arrive in time, or products the supplier doesn’t carry.
It’s the same constraint as every other AI feature. The data underneath has to be solid.
Anomaly detection
Anomaly detection monitors your data for things that look wrong, like a price spike, an unexpected stock movement, or a cost that doesn’t add up.
Most restaurant operators don’t want to check dashboards. They want to be told when something needs their attention. As an Apicbase user put it, “we want advice based on trend analyses and pattern detection.” That’s the right way to think about AI in operations. Not reporting on the past, but catching problems before they affect the next service or gross margin.
Good data makes AI reliable
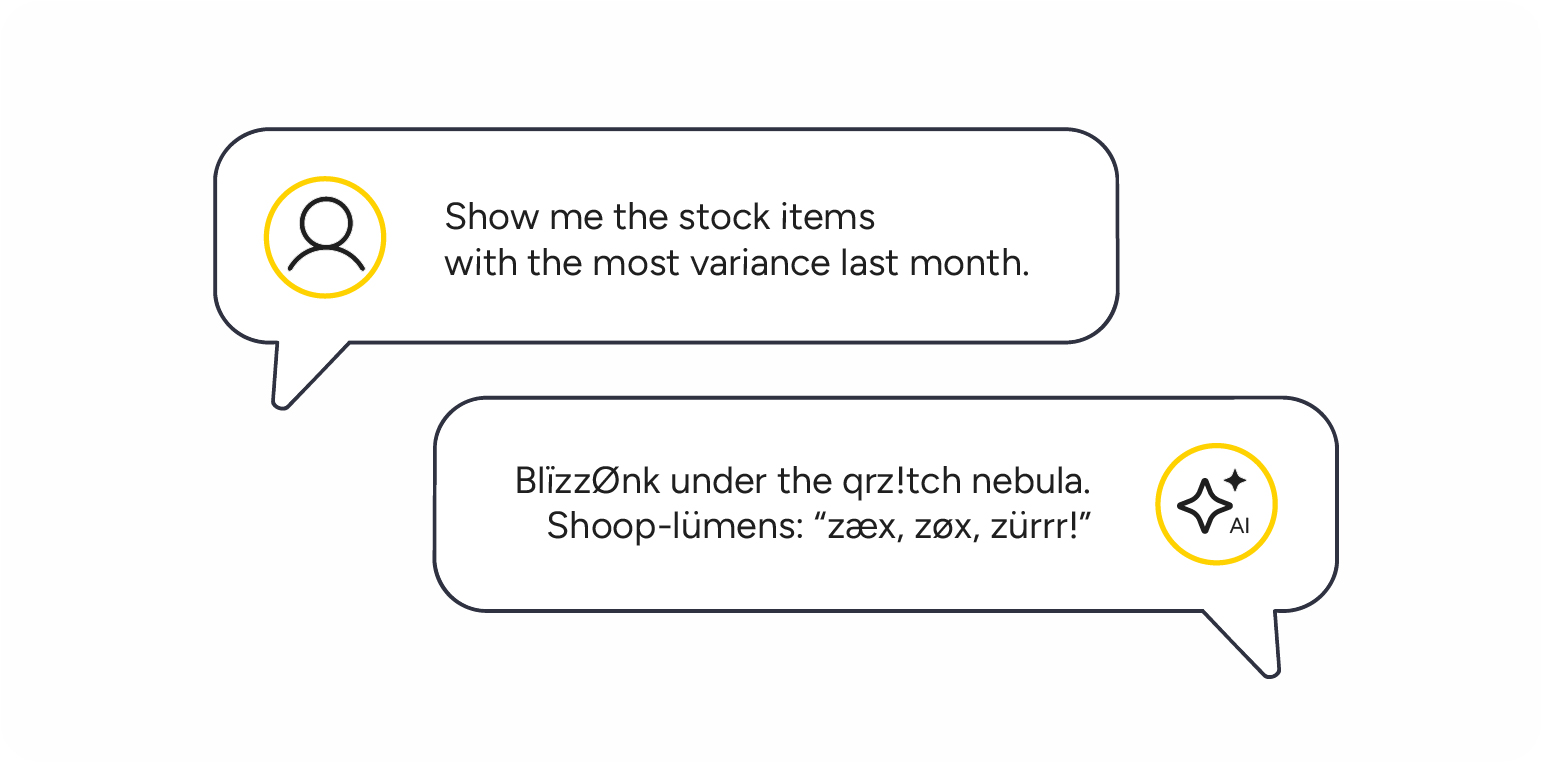
AI can forecast demand and suggest orders, but there’s a caveat: it’s only as accurate as the data it runs on. Feed it stale numbers, and you’ll still end up over-ordering at one site while another runs short.
The same rule applies beyond forecasting. When the data foundation is solid, operators can query it via MCP (Model Context Protocol) and get reliable answers. When it isn’t, AI will correlate and extrapolate from incomplete information — or worse, make something up. Garbage in, garbage out still applies.
More on getting your AI-ready data foundation right.
How is multi-site inventory different from single-site?
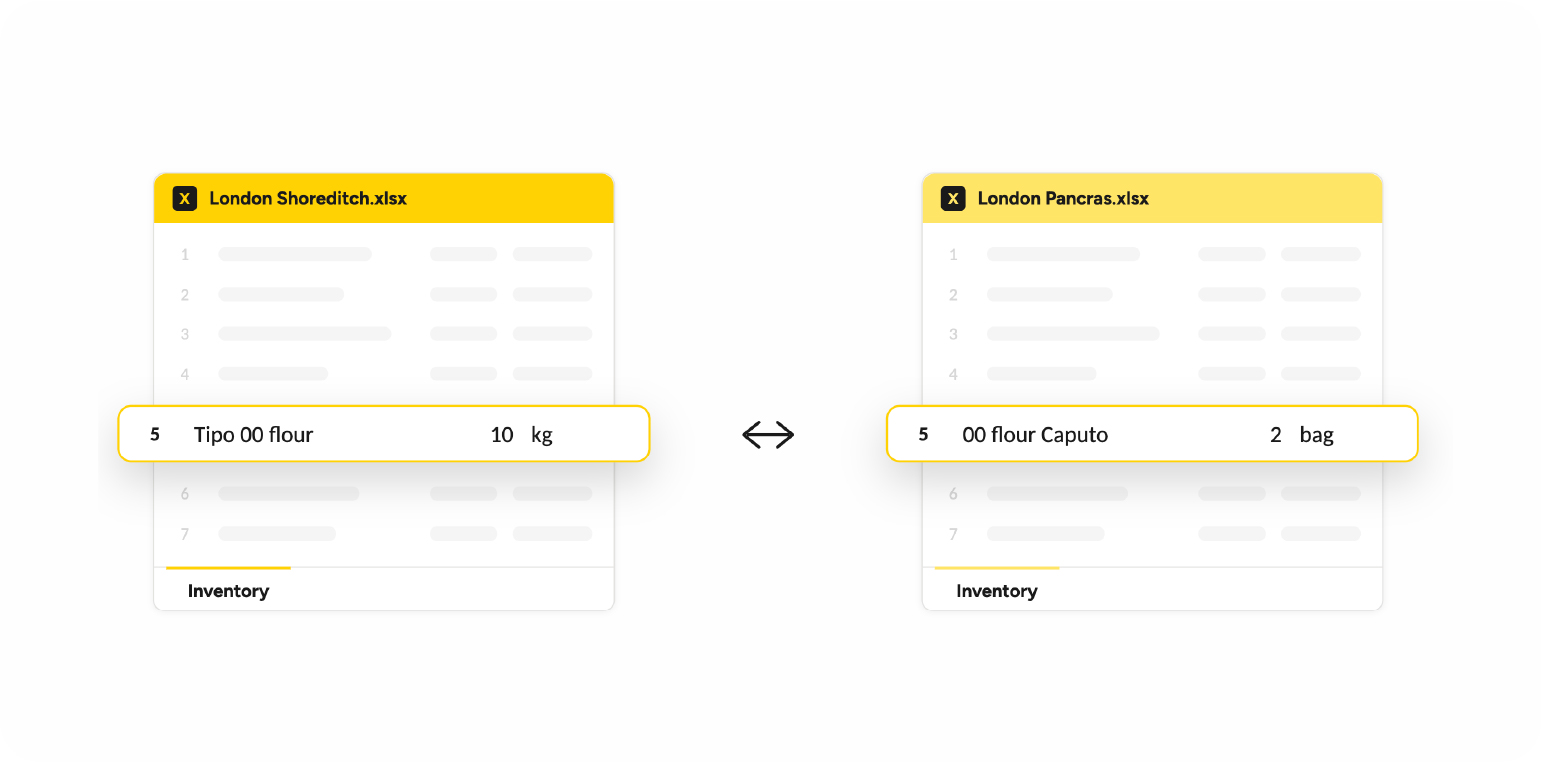
At one restaurant, accuracy comes down to discipline: count carefully, in consistent units, on a regular cadence. At 200 locations, accuracy in any single kitchen isn’t enough; what matters is whether the data is comparable across all sites.
If two sites count in different units, use different names for the same product, or work from different versions of a recipe, you can’t roll their numbers up or benchmark one against another, and group-level food cost becomes a top-line average with nothing but gibberish underneath.
Three things make inventory work in a multi-site operation:
1. Shared standards
Shared standards mean every outlet runs on the same setup: the same product names, the same units of measure, the same recipes, and the same stock control process. So when the team from London Shoreditch counts stock, it means the same as when the team from London Pancras does.
2. Roll-up reporting
Roll-up reporting consolidates all sites into a single view without manual reassembly or spreadsheet consolidation.
3. Cross-site benchmarking
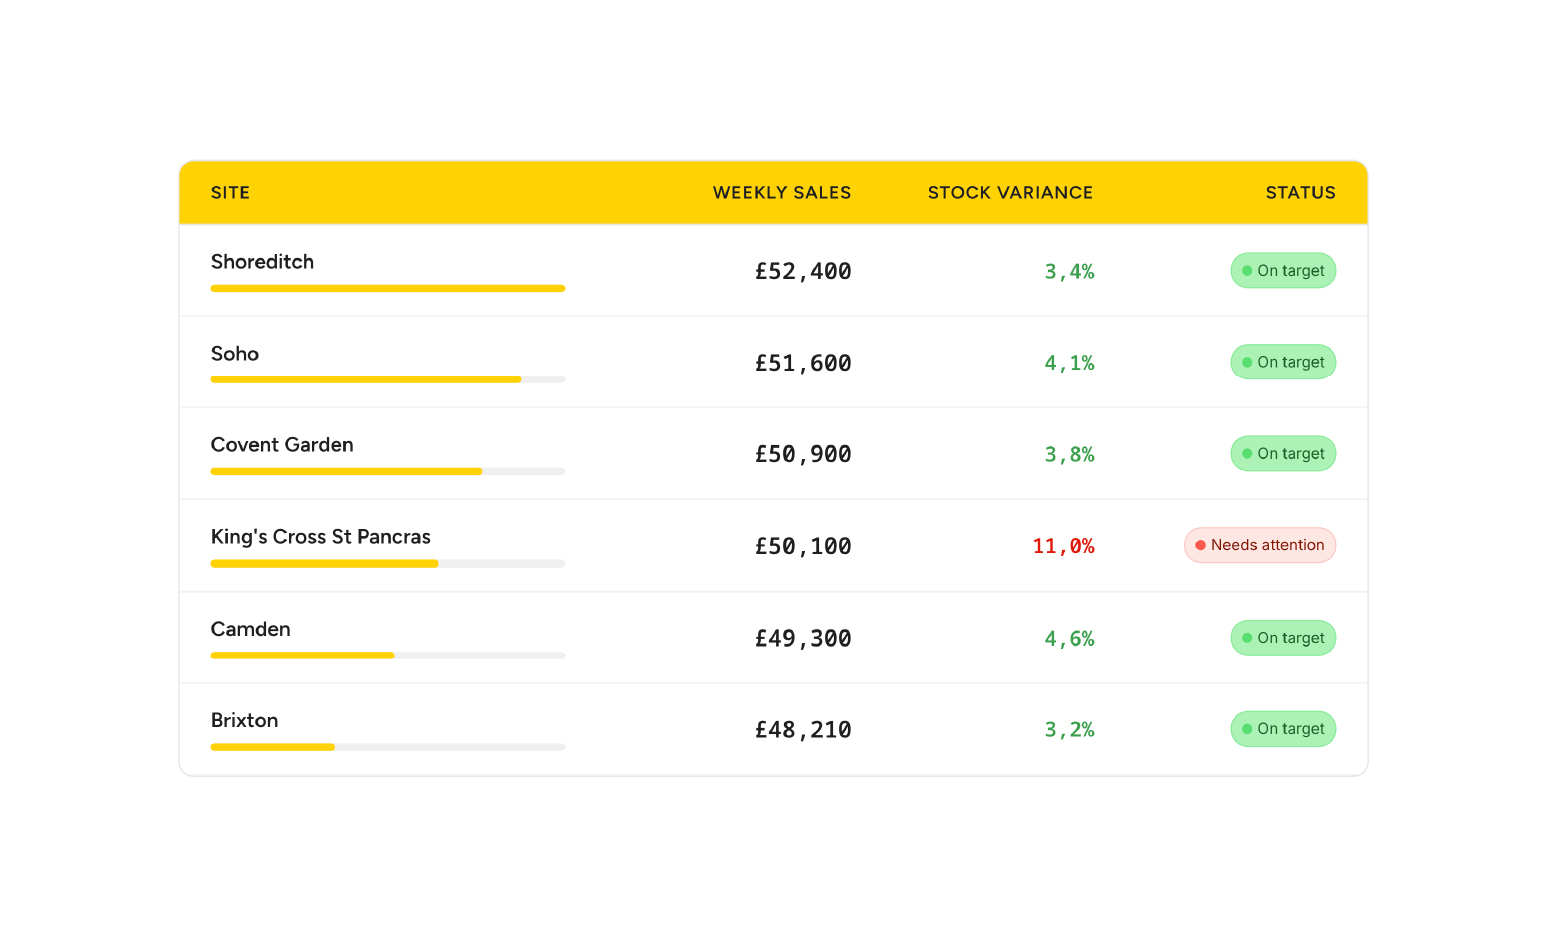
Cross-site benchmarking means that when 185 of your 200 sites show a 3% variance, and two show a 5% variance, the outliers are obvious. You know exactly where to look and what to fix.
That comparison also tells you whether the problem is systemic or local. High variance across all sites points to recipe costing or supplier pricing. High variance at one site points to portions, waste, or process. Two very different problems that require very different approaches to solve. Seeing all of this at once is what multi-site dashboards are for.
How tech solves inventory challenges
Every challenge in this restaurant inventory guide has the same root cause: back-of-house data is scattered across spreadsheets, invoices, and people’s heads. There is no single source of truth everyone can trust.
Enterprise inventory platforms like Apicbase solve this by bringing everything together in one place. They manage purchasing, track stock depletion, automate reorders, and generate reports automatically.
Stock, recipes, purchasing, and food cost are all part of a single, connected model across all sites. There’s no guesswork. What’s left is control, and control is what protects your margin.
That changes each of the challenges raised earlier:
- You can trust the reports. Counts, recipes, purchasing, and sales all sit in one system. The numbers line up rather than contradict each other across spreadsheets.
- Stock counting gets faster. Staff count on a phone with voice and barcode scanning instead of clipboards. A stocktake takes a fraction of the time and is actually completed.
- No more reconciling spreadsheets. Stock counts update ordering and reporting automatically. The data is neatly organised in the system, so you don’t need to export files.
- Food cost becomes actionable. The system calculates theoretical vs actual variance and ties it to recipe-level costing. Gaps show up instantly for you to mitigate.
- Purchasing gets right-sized. Demand forecasting proposes orders per site and per supplier based on recent sales and lead times. Overordering and stockouts stop being a problem.
- You can compare sites. Shared standards mean that inventory management is done the same way across sites. Roll-up reporting puts all sites in a single view. Cross-site benchmarking shows you which outlet needs attention.
Multi-site restaurant operators use Apicbase to manage stock-taking, purchasing, and food cost data across every location from one system. It helps reduce food costs by around 5% through better variance control and saves each site several hours a week on stock counts and admin.
At scale, the numbers get bigger fast. One director at a 220-site group found that roughly 1.2% of food spend disappeared as unexplained shrinkage. Closing that gap saved them millions.
A Scandinavian restaurant chain saved €10,200 a year on a single ingredient simply by making supplier pricing visible across sites. Circus Kitchen cut food cost by 18%, citizenM trimmed 2% across its 37 hotels, Bright Kitchen’s food cost dropped by 8%, and Restaurant Company Europe runs 75+ locations from a single source of truth.
When should you switch from spreadsheets to inventory software?
Spreadsheets work up to a point. But once two or three of these problems appear, they’ve become a bottleneck:
- You’re running more than a handful of sites and still consolidating inventory by hand.
- You don’t trust your COGS, or you get it too late to do anything about it.
- The same product has different names or units across locations.
- You’re dealing with both stockouts and over-ordering.
- You want to use AI for forecasting, but your inventory data is incomplete or inconsistent.
If these sound familiar, spreadsheets are probably costing you time and money. That’s the point where restaurant operators switch to restaurant inventory management software. Platforms like Apicbase give multi-site businesses a single source of truth for inventory, purchasing, and food costs.
Conclusion: Managing inventory across a multi-site restaurant group
Restaurant inventory management keeps food costs under control. It means tracking what you have in stock, setting par levels, checking deliveries, and comparing inventory usage with sales.
At one location, success comes down to discipline. Across 20 or 200 locations, it comes down to consistency.
Without consistent processes and data, stock variance becomes a meaningless KPI. It measures the gap between what your recipes and sales say you should have used and what you actually used. Well-run restaurant groups keep that gap below 3%. Many operators run 6% to 9% higher without realising it.
AI can now help forecast demand, recommend purchase orders, and spot unusual inventory patterns before they become expensive problems. But it only works if your inventory data is accurate, standardised, and shared across every location.
That’s what modern restaurant inventory management is really about: creating a single source of truth for your entire operation.
If you’re managing more than a handful of sites and still relying on spreadsheets, it’s time to move to a dedicated inventory system. Platforms like Apicbase create a single system of record that gives AI the data it needs to forecast demand, recommend orders, and spot problems early. They centralise inventory, purchasing, recipes, and food cost data, so you spend less time chasing numbers and more time improving performance.

Standardise inventory across every site with Apicbase
Manage stock counts, recipes, purchasing, and food cost variance across all your locations from a single system. Apicbase also includes built-in AI and connects with AI tools like ChatGPT, Claude, and Microsoft Copilot.
Frequently asked questions
For a single small site, yes, a well-built spreadsheet can handle counts and par levels perfectly well, but Excel tends to break at scale. The reasons are that it doesn’t integrate sales or recipe data, each location keeps its own version of the spreadsheet, and consolidating multiple sites into a single reliable view is a manual, error-prone job.
Multi-site restaurant operators use systems like Apicbase to connect sales, recipes, and stock counts across all sites, so the numbers roll up automatically.
Yes. Simple apps work for single-site counting, but enterprise groups running multiple sites use systems like Apicbase to feed counts directly into purchasing and food cost, so every location works from the same numbers instead of a separate spreadsheet per site.
Count high-value, fast-moving items — proteins, dairy, and beverage stock — daily or per shift, and count everything else weekly. Beverage inventory management, in particular, rewards a tighter cadence because spirits and wine are high-value and easy to lose track of. Consistency matters more than frequency: same time, same units, every period.
The FIFO (First-In, First-Out) method is the best choice for restaurants. It ensures older stock is used first, reducing waste and keeping food fresh. FIFO works with both periodic and perpetual inventory systems, making it ideal for managing perishables.