Restaurant reports turn chaotic data into clear, digestible information. They allow you to compare performance across dishes, menus, and locations. Combined with restaurant analytics software, they allowcent you to uncover insights hidden in the raw data.
You can dig into the details and get a high-level overview of performance, efficiency, and profitability.
In this article, we’ll discuss the importance of restaurant reports and how to access the right insights. We will then examine nine key restaurant reports to monitor to secure your restaurant’s financial health and profitability.
What Are Restaurant Reports?
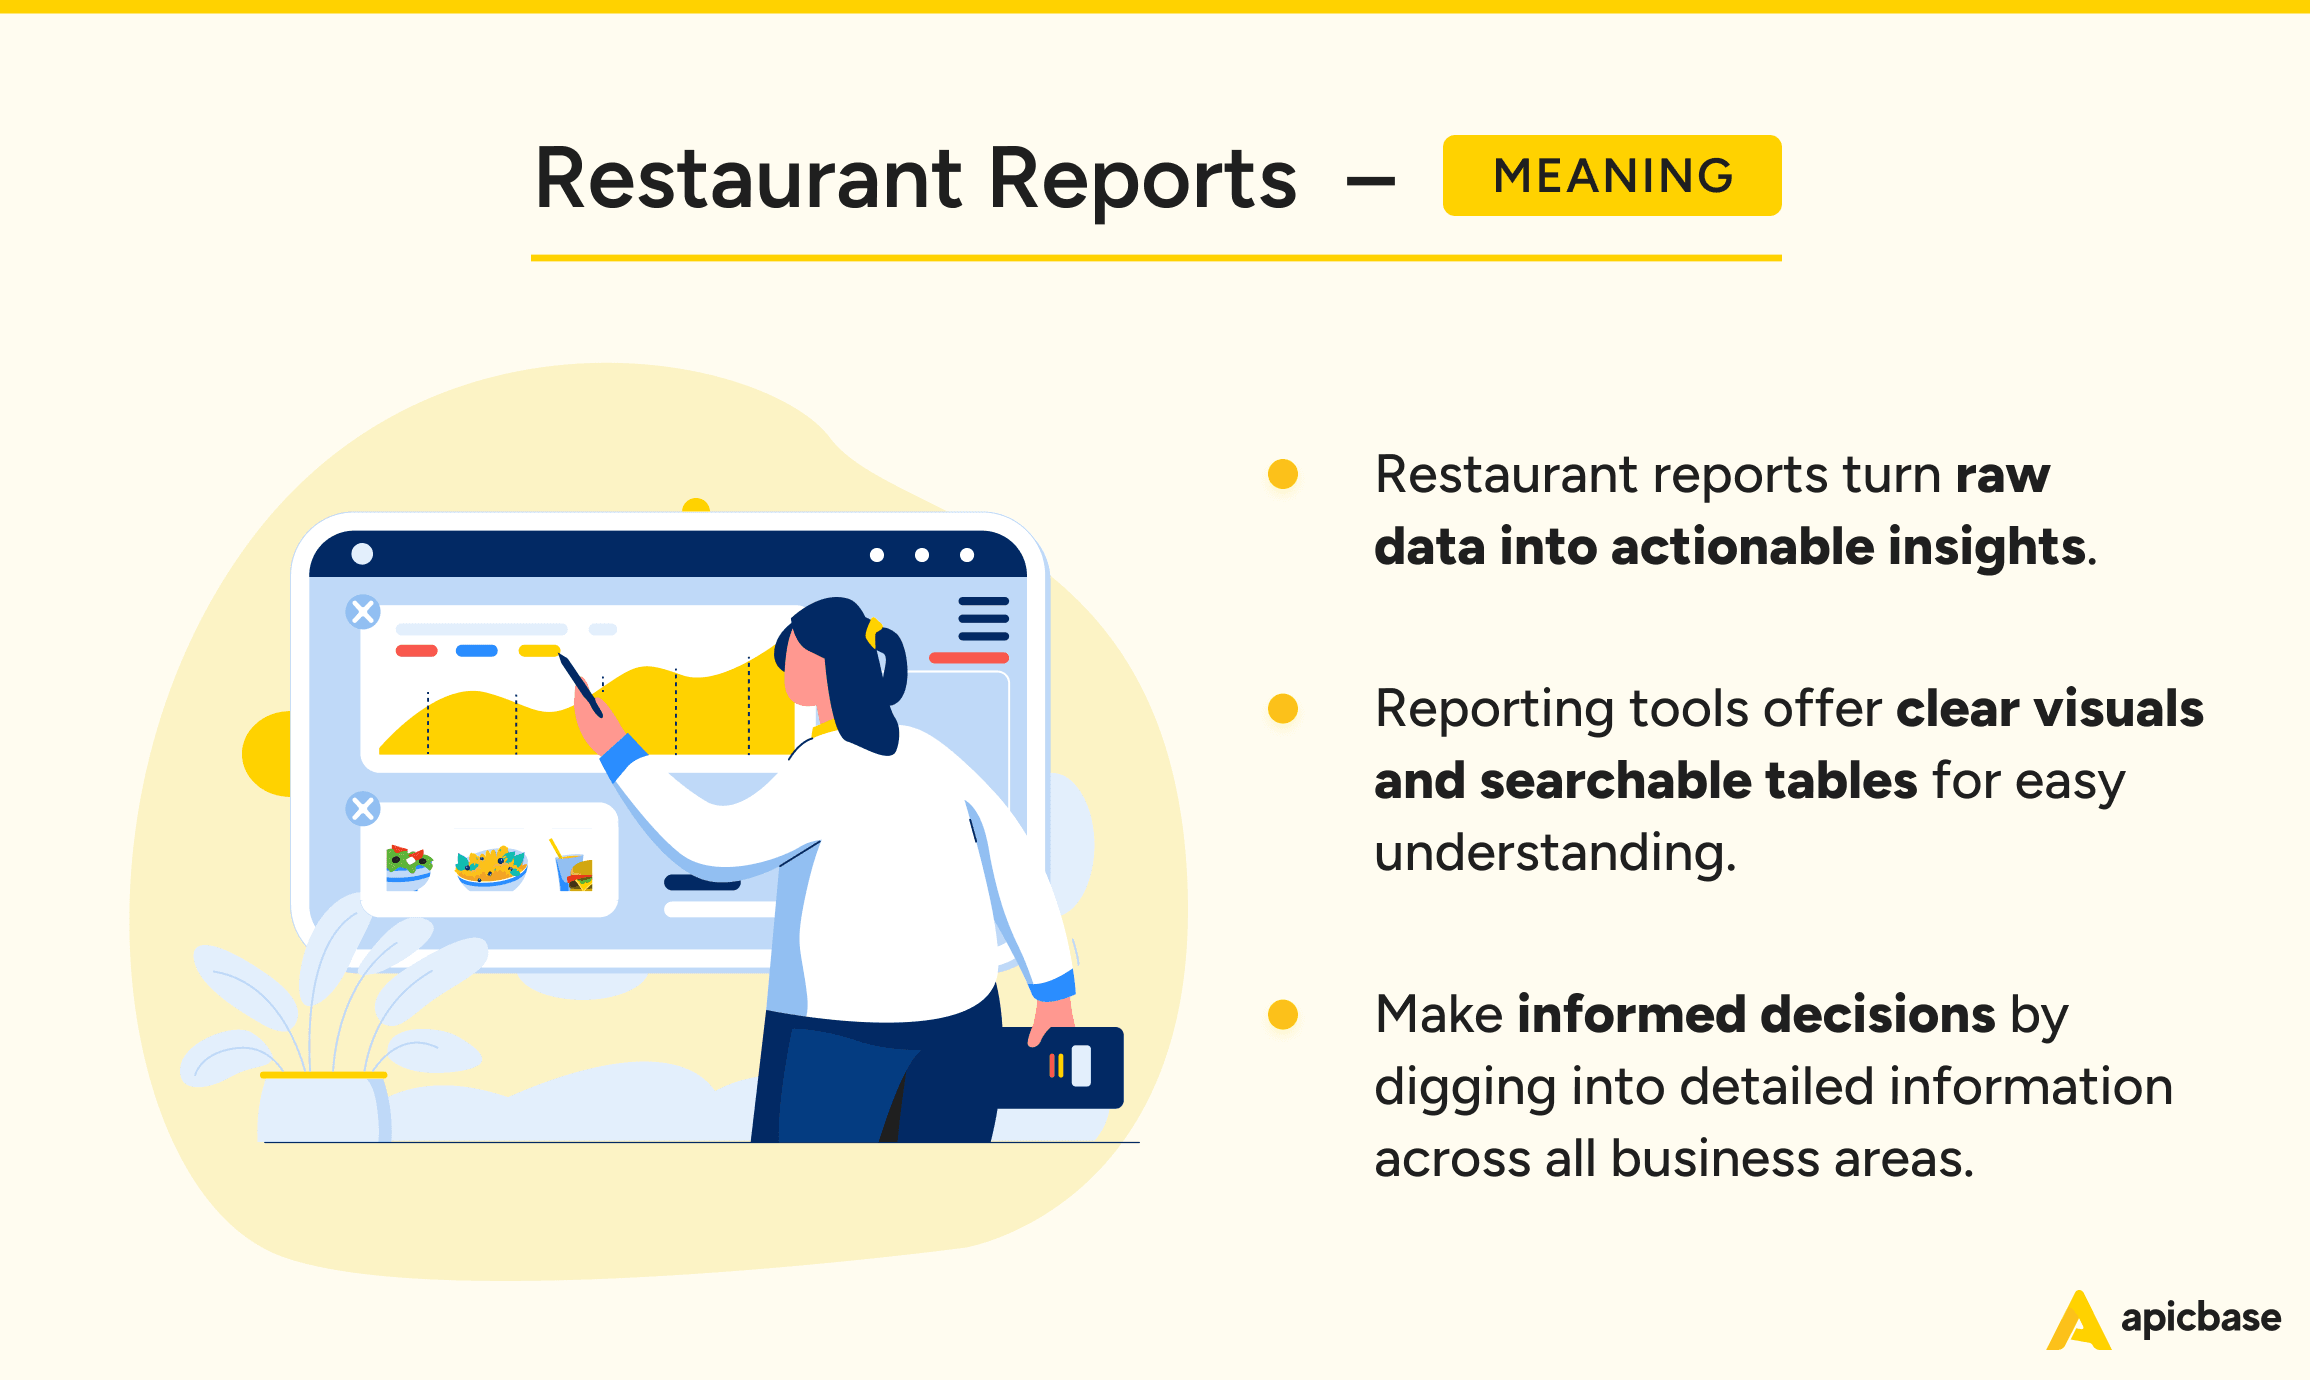
Restaurant reports turn raw data into useful information. A restaurant’s raw data includes sales numbers, inventory data, ingredient pricing, recipe quantities and units, and financial figures.
Reporting tools take all of this information and present it as clear charts, graphs, lists, searchable tables, and other easily understood formats. Reports give managers an overview of restaurant operations at a glance and also allow them to search and dig into the details to uncover granular insights about every part of the business.
Why Restaurant Reporting Matters
Restaurant reporting is a critical tool for managers. It provides the insights to make informed decisions, optimise operations, and drive the restaurant’s success.
Without it, managers would be faced with manually sifting through raw data from multiple sources.
The best reporting tools turn data into actionable intelligence, enabling a proactive rather than reactive approach to management.
Let’s discuss the areas where restaurant reports have the most impact.
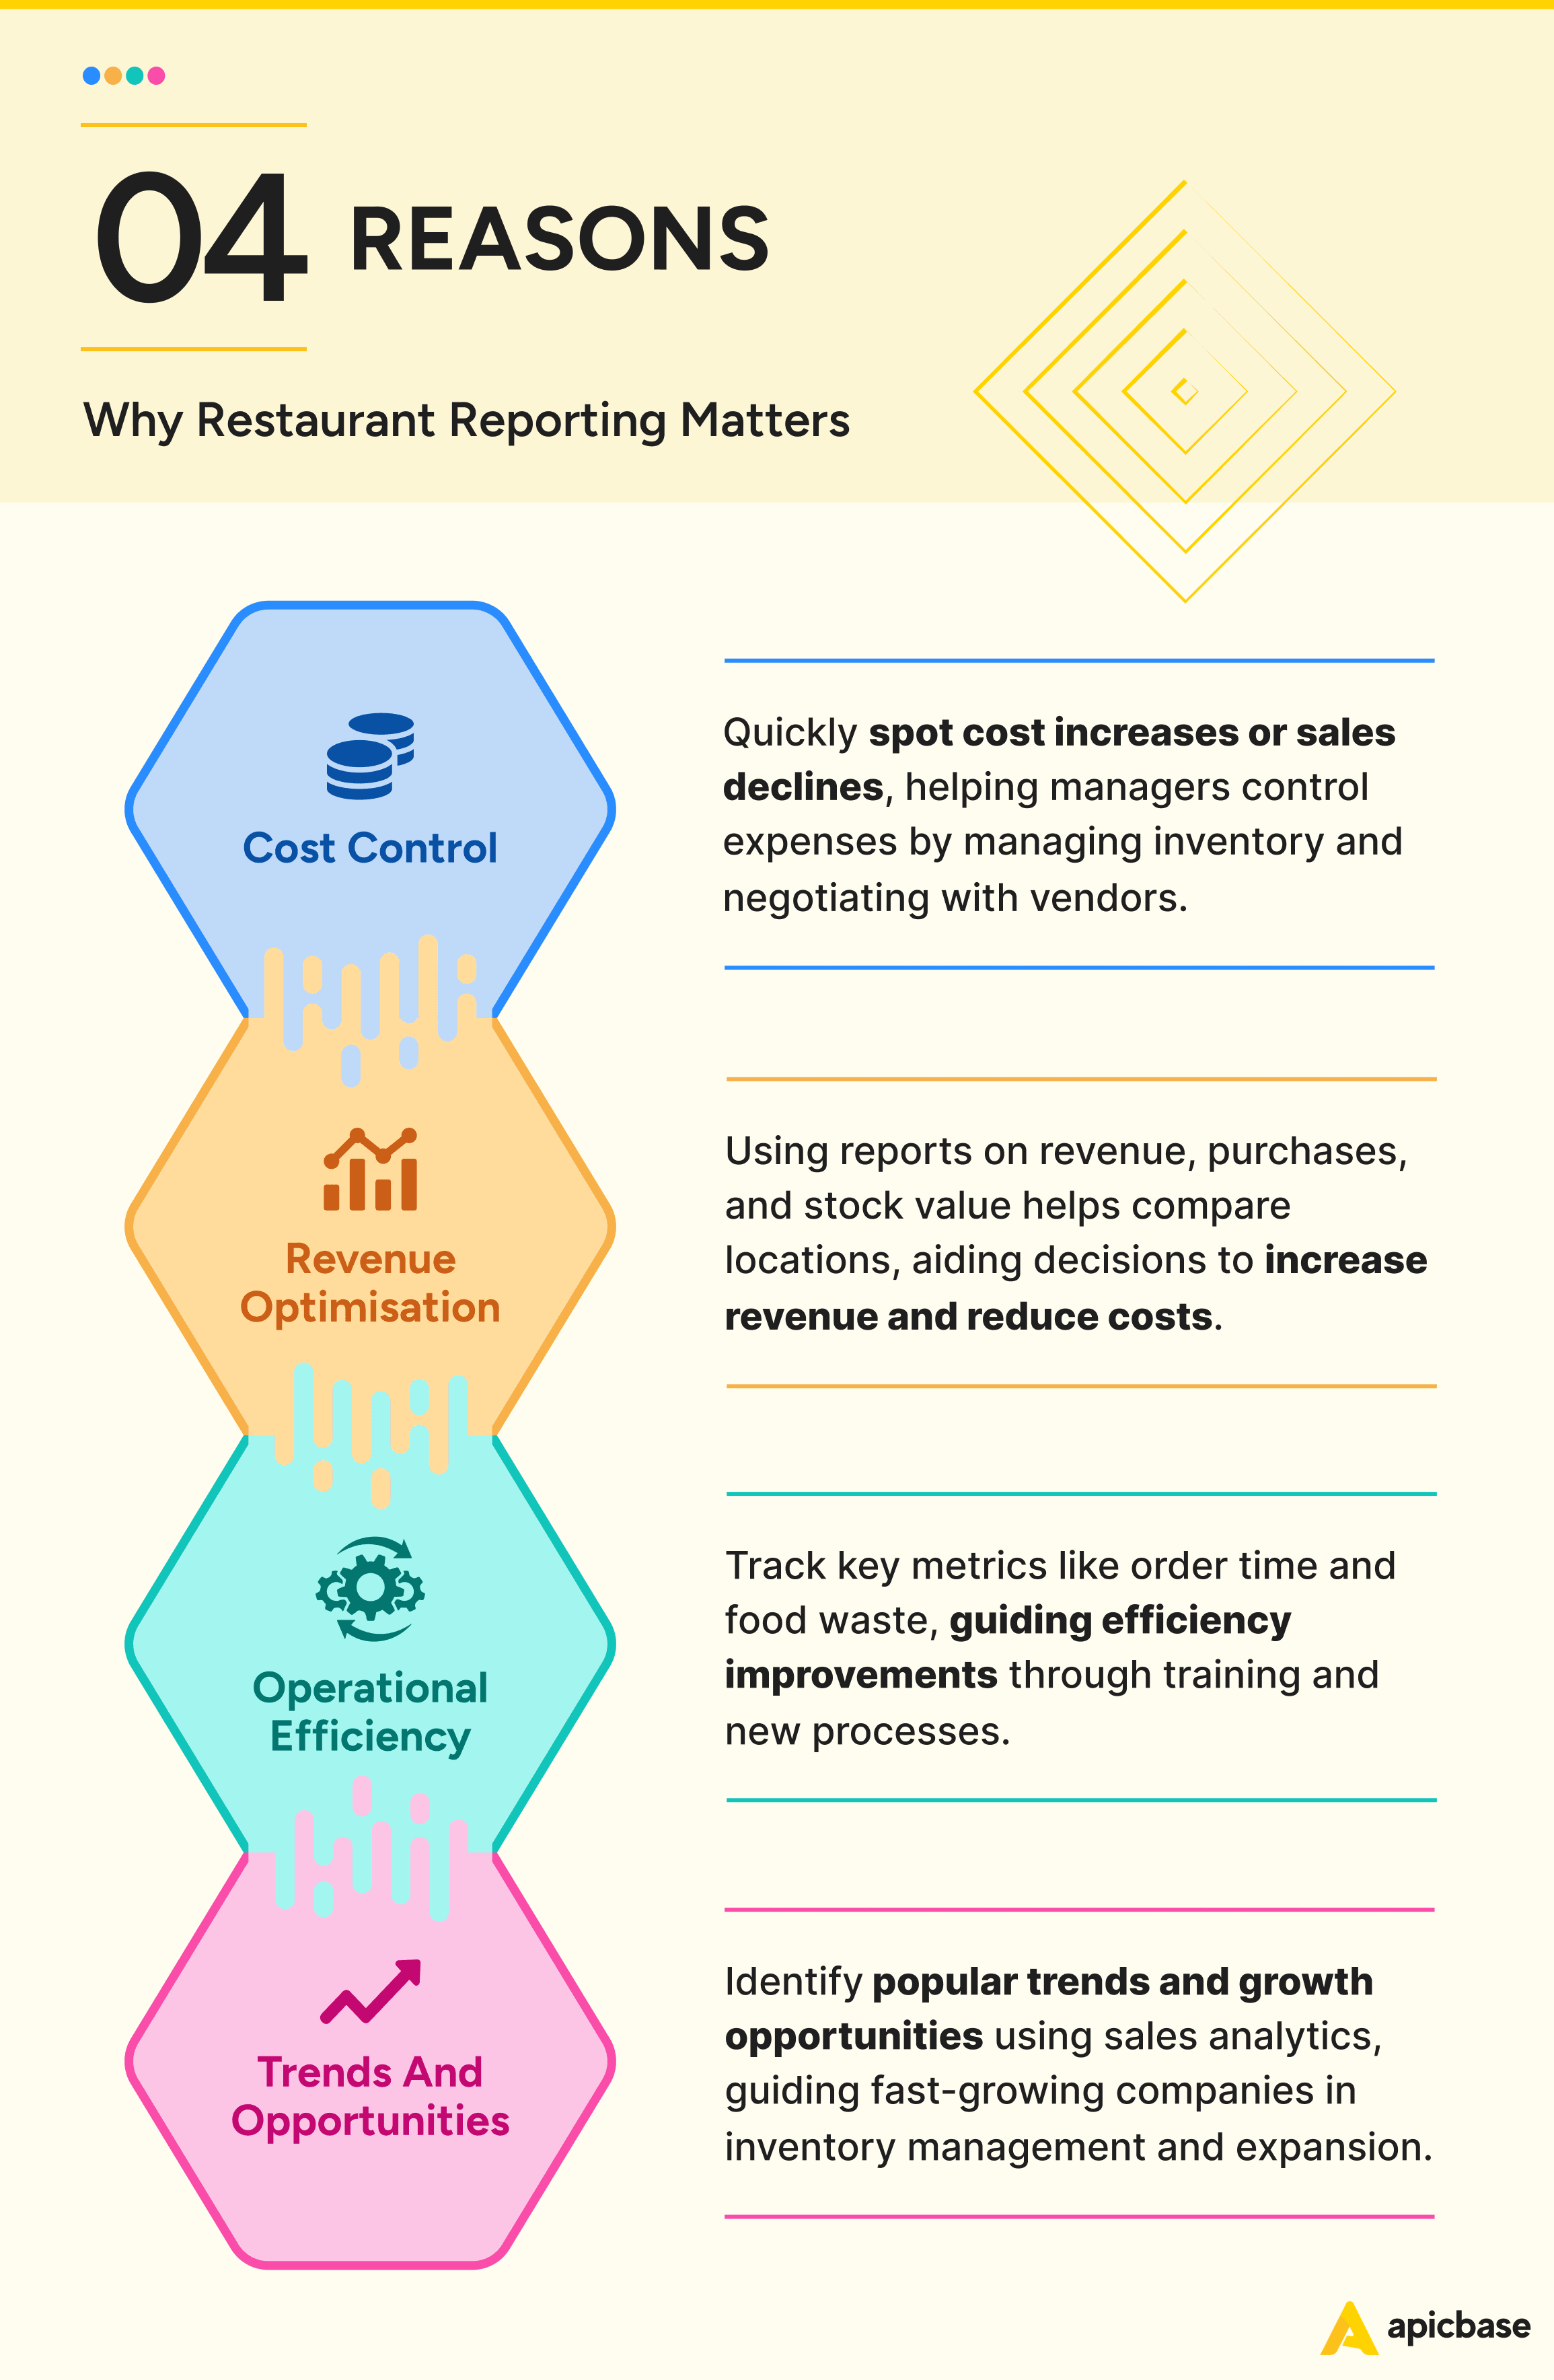
Cost control
When faced with a rise in costs or a dip in sales, restaurant managers must find the cause as quickly as possible. Restaurant reports give you insights into what has caused a problem and how to fix it.
For example, a regular report on your inventory variance tells you the difference between your actual and expected inventory. This snapshot helps you prevent overstocking and reduce food costs.
An item price report lets you see how prices have changed over time. This allows you to renegotiate with vendors or change your menu to use a better-value ingredient.
These two examples are just the tip of the iceberg. For large food service operations with 100s of units, a 1% reduction in food costs alone could already lead to several hundred thousands of euros in additional gross profit.
Revenue optimisation
Reports on your total revenue, total purchased value, and total stock value clearly show your restaurant’s profitability and allow you to compare performance quickly across locations.
When you understand why one location is performing better, you can implement these best practices at the locations needing help.
Monitoring revenue per location over time helps you identify struggling locations and give your managers the additional support they need long before things start to spiral out of control.
With these insights, you can make the strategic decisions necessary to reduce unnecessary spending and grow revenue across your restaurant locations.
Recommended read: 12 Examples of Revenue-Driving Restaurant Insights
Operational efficiency
Efficient processes are essential for controlling costs. The restaurant reports help to monitor progress. The included metrics and restaurant KPIs indicate whether your restaurants are moving in the right direction.
For example: Reports on the time taken to produce an order, speed of delivery, food cost percentage, inventory variance, and food waste give you insights into the efficiency of your operations.
When these restaurant metrics fall below acceptable standards, you can make changes to improve training, better incentivise employees, and adopt new processes and tech to make everyday operations more efficient.
Identifying trends and opportunities
Reporting doesn’t just help you look back at what’s happened and make positive changes. It allows you to look at trends and proactively identify opportunities to grow and improve.
Restaurant reports are especially valuable when combined with sales analytics tools, which analyse your COGS and sales.
Reporting tools can help you predict demand, for example, so you can stay ahead of production and inventory to cope with a busy period. They can also identify opportunities to open new locations by analysing existing restaurant data.
Identifying trends and surface opportunities is critical for ambitious companies looking to expand and stay ahead of the competition.
Recommended read: Demand Forecasting Software for Restaurants
How to Get Restaurant Reports
Most restaurants use software like POS systems, inventory management systems, and accounting tools to manage various parts of the business. These tools can usually generate reports based on the data they collect.
POS systems can tell the total sales, staff hours, and most popular dishes. Accounting tools can give you revenue figures and total costs. But if these systems don’t talk to each other and share data, there’s a limit to how useful these reports are.
An all-in-one restaurant BOH management platform like Apicbase integrates with other software to share data across the company and its locations. This means you can get business-wide reports that make a difference. You can access everything from one place and get the real-time information you and your employees need to make informed decisions.
9 Essential Restaurant Reports
Managing a restaurant involves a delicate balance: keeping customers satisfied, maintaining high quality, and controlling costs. Restaurant reports give you a quick snapshot of how well you manage these competing priorities.
Let’s look at the most impactful reports that help managers improve quality and efficiency, and reduce costs.
Inventory
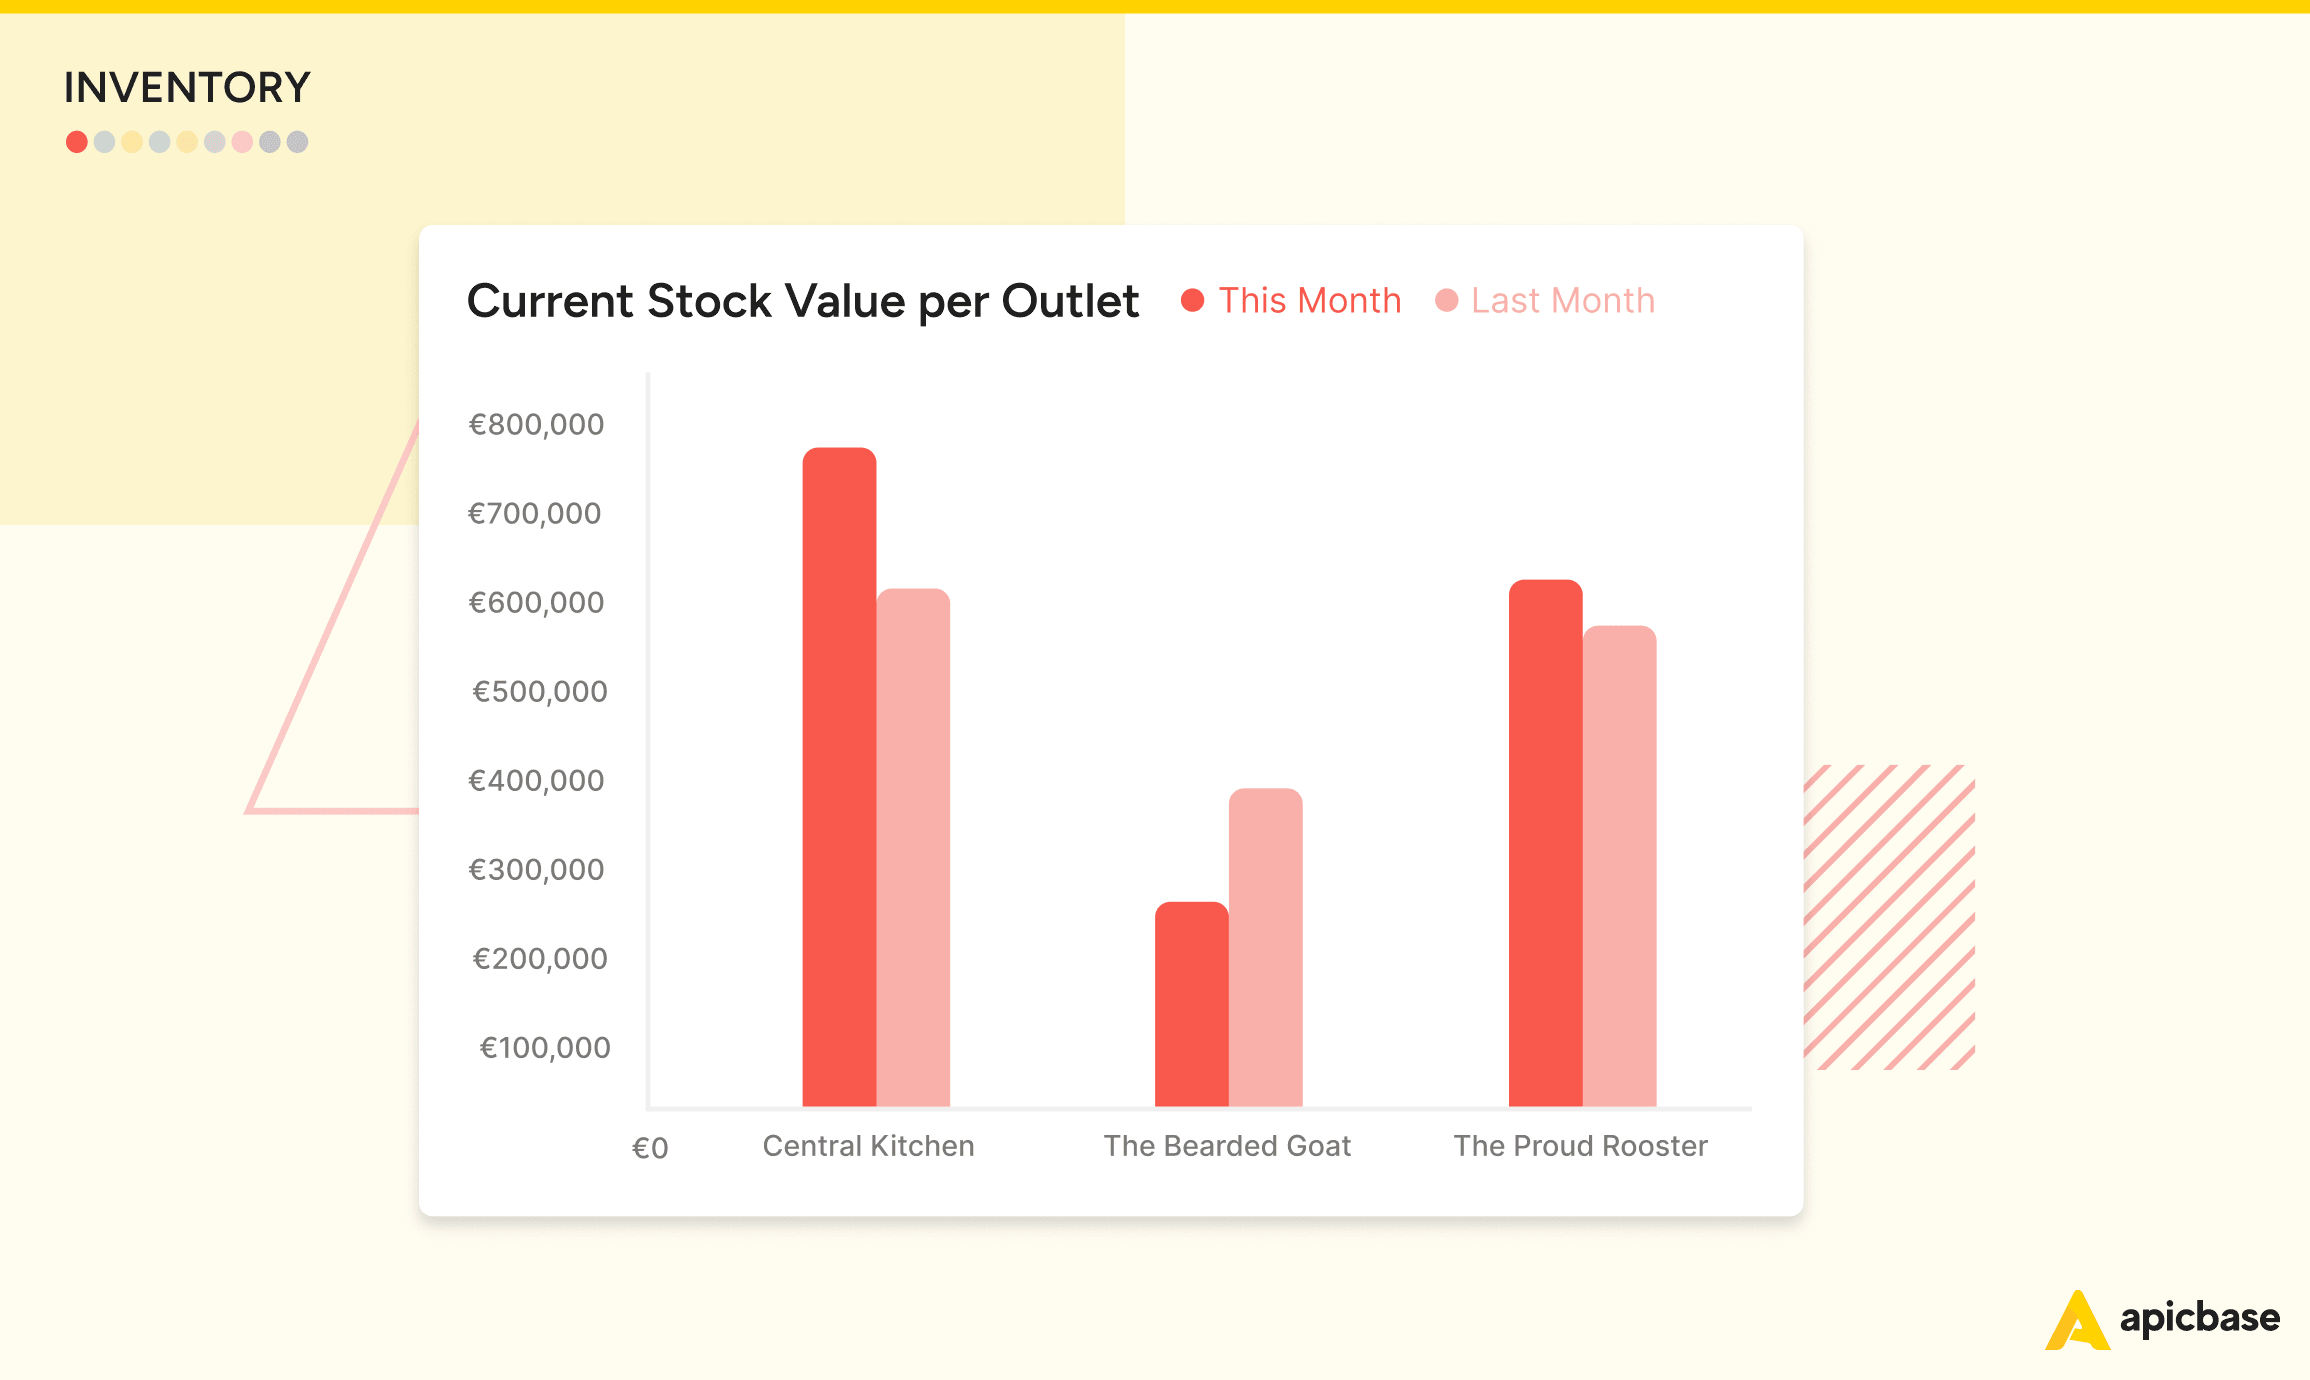
Restaurant inventory management reports tell you everything about the state of your stock levels and the value of purchased ingredients. This information is crucial for reducing overstocking and keeping food costs under control.
The best restaurant inventory management software automatically tracks your inventory levels and tells you the total value of your purchased inventory and whether you have any negative stock. Employees can easily search for items to check their quantities and values. By using filters, they can precisely assess how much to order to meet demand and maintain optimal stock levels. These actionable insights are critical to minimising food waste.
Procurement
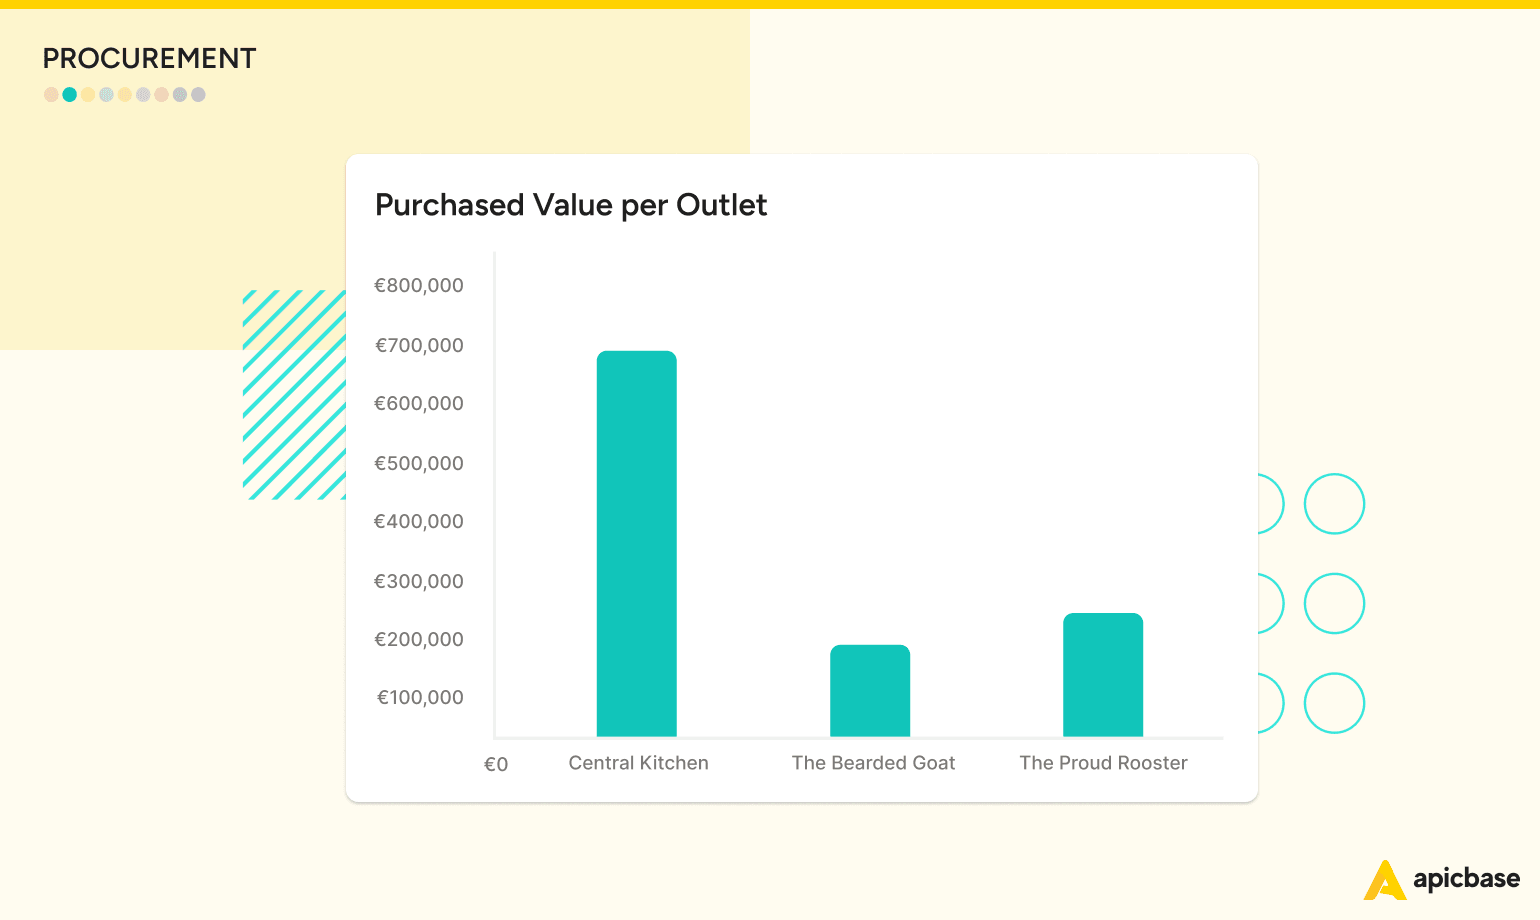
Effective purchasing control means managing supplier relationships, ordering according to current stock levels, and negotiating better prices. Restaurant procurement management reports provide your staff with critical information to avoid overbuying or running low on stock. These reports reveal purchasing trends, average order values per supplier, and the purchasing activities at each location. This information is essential for controlling food costs and optimising inventory levels.
Sales Trends
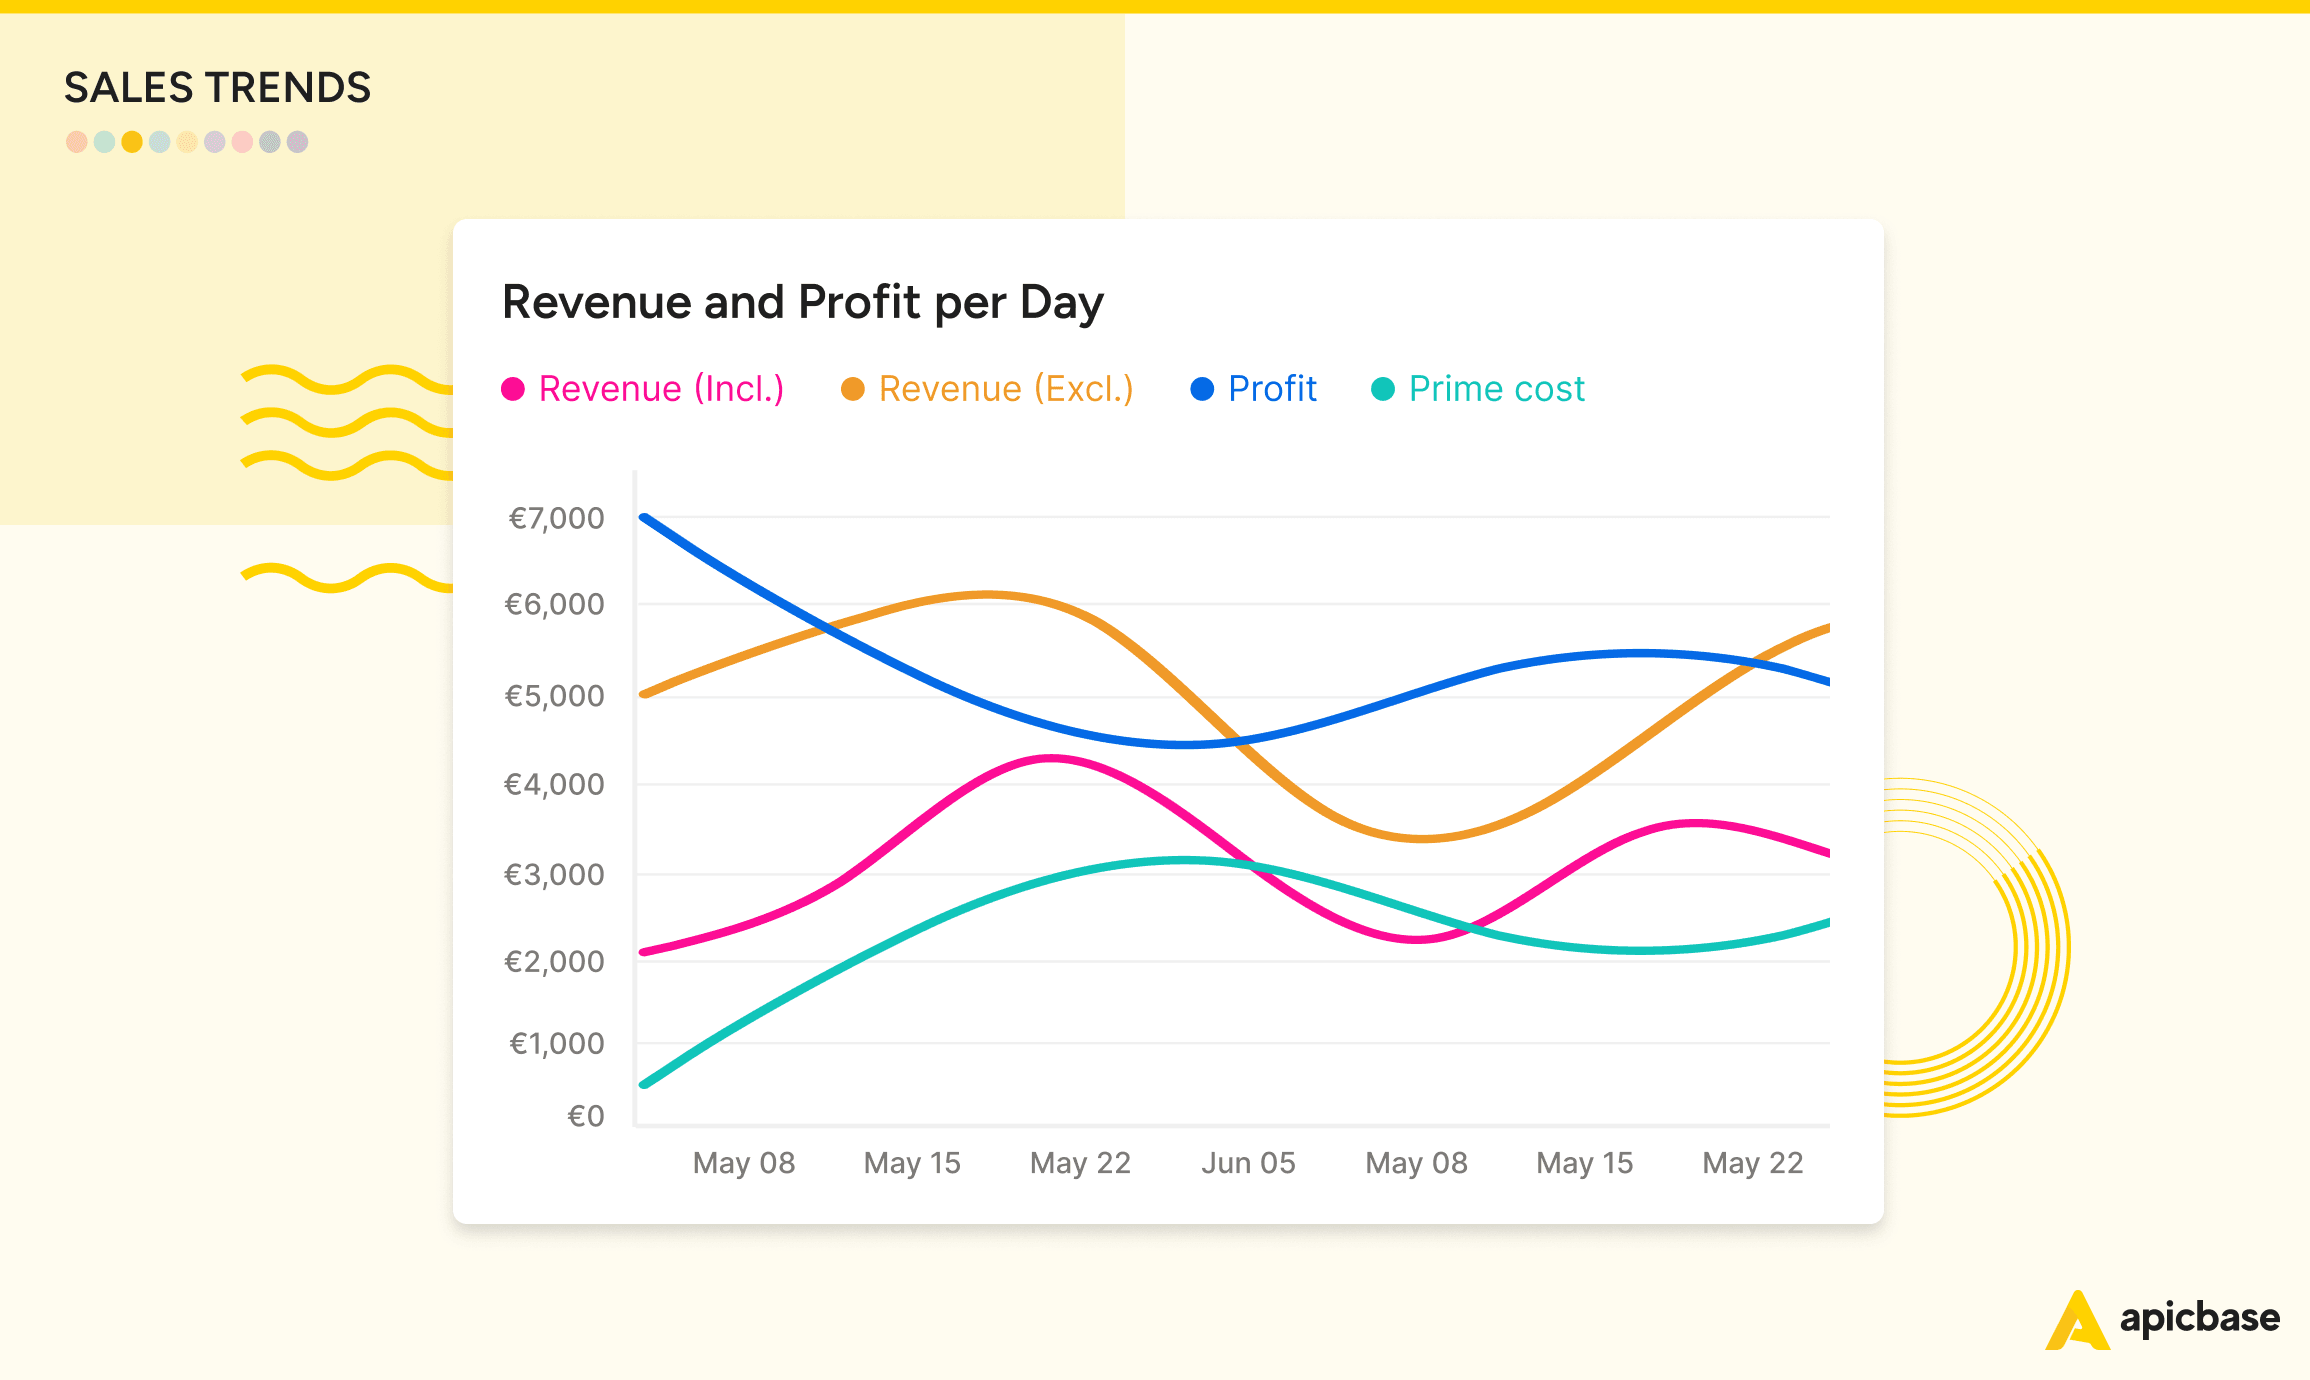
Sales data is crucial for assessing the health and profitability of your restaurant business. Sales reports provide an overview of business performance across various locations, but the true value lies in analysing sales trends. Reports on sales trends combine sales figures, inventory usage, and the cost of goods sold to uncover opportunities to boost business and enhance profit margins.
For example, they can help adjust menu pricing for high-demand items with low-profit margins due to high costs, optimise the menu by revising or removing less popular or low-margin items, and improve inventory purchasing by using insights on which ingredients are used most to reduce costs and minimise excess.
Outlet Performance
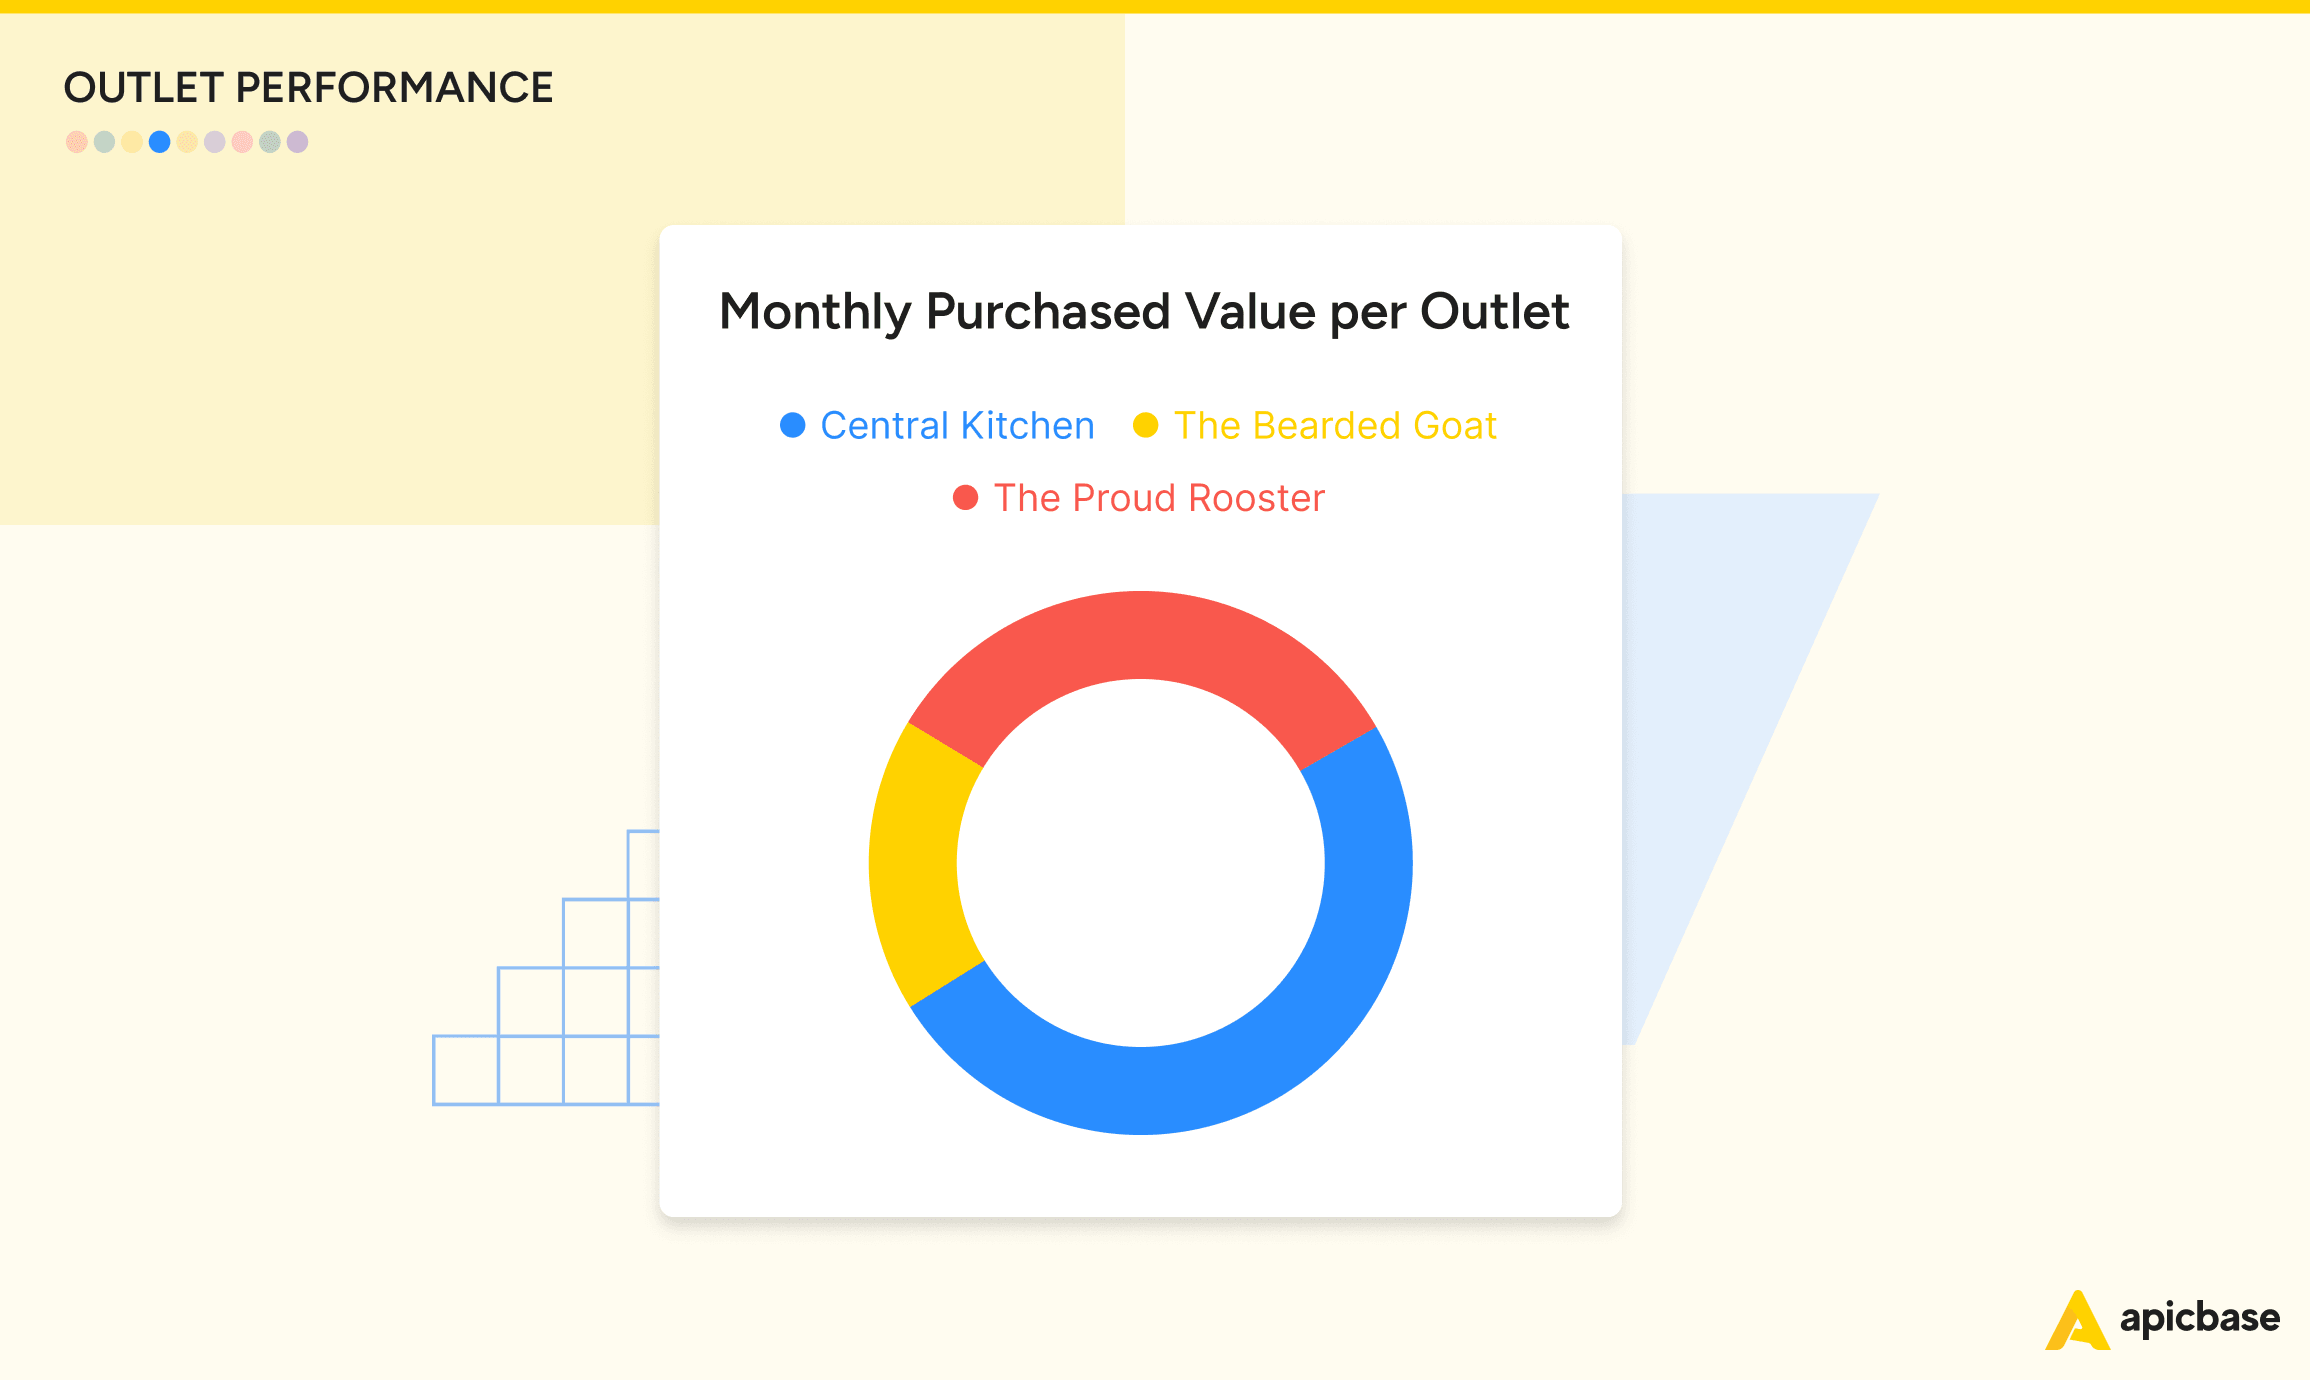
For large restaurant groups and food service companies with multiple units, comparing the performance of different outlets is essential. By identifying the top-performing locations, you can set benchmarks to elevate the standards of the other outlets to match these high performers.
Group outlet performance reports provide a snapshot of profitability, efficiency, and financial health across various locations. These reports cover a range of metrics, including inventory value, food waste, and food cost percentage for each outlet. With real-time data updating these reports, you can quickly identify which locations require immediate attention and make informed decisions to improve their performance.
These reports are particularly valuable for operations using central kitchens and needing to send stock between locations. You can easily view the inventory levels and stock values at each location. This turns the often messy internal ordering logistics into a well-oiled machine. Additionally, with all data consolidated in one system, you can effectively track and monitor the status of orders, ensuring smooth operations across your network.
Variance Analysis
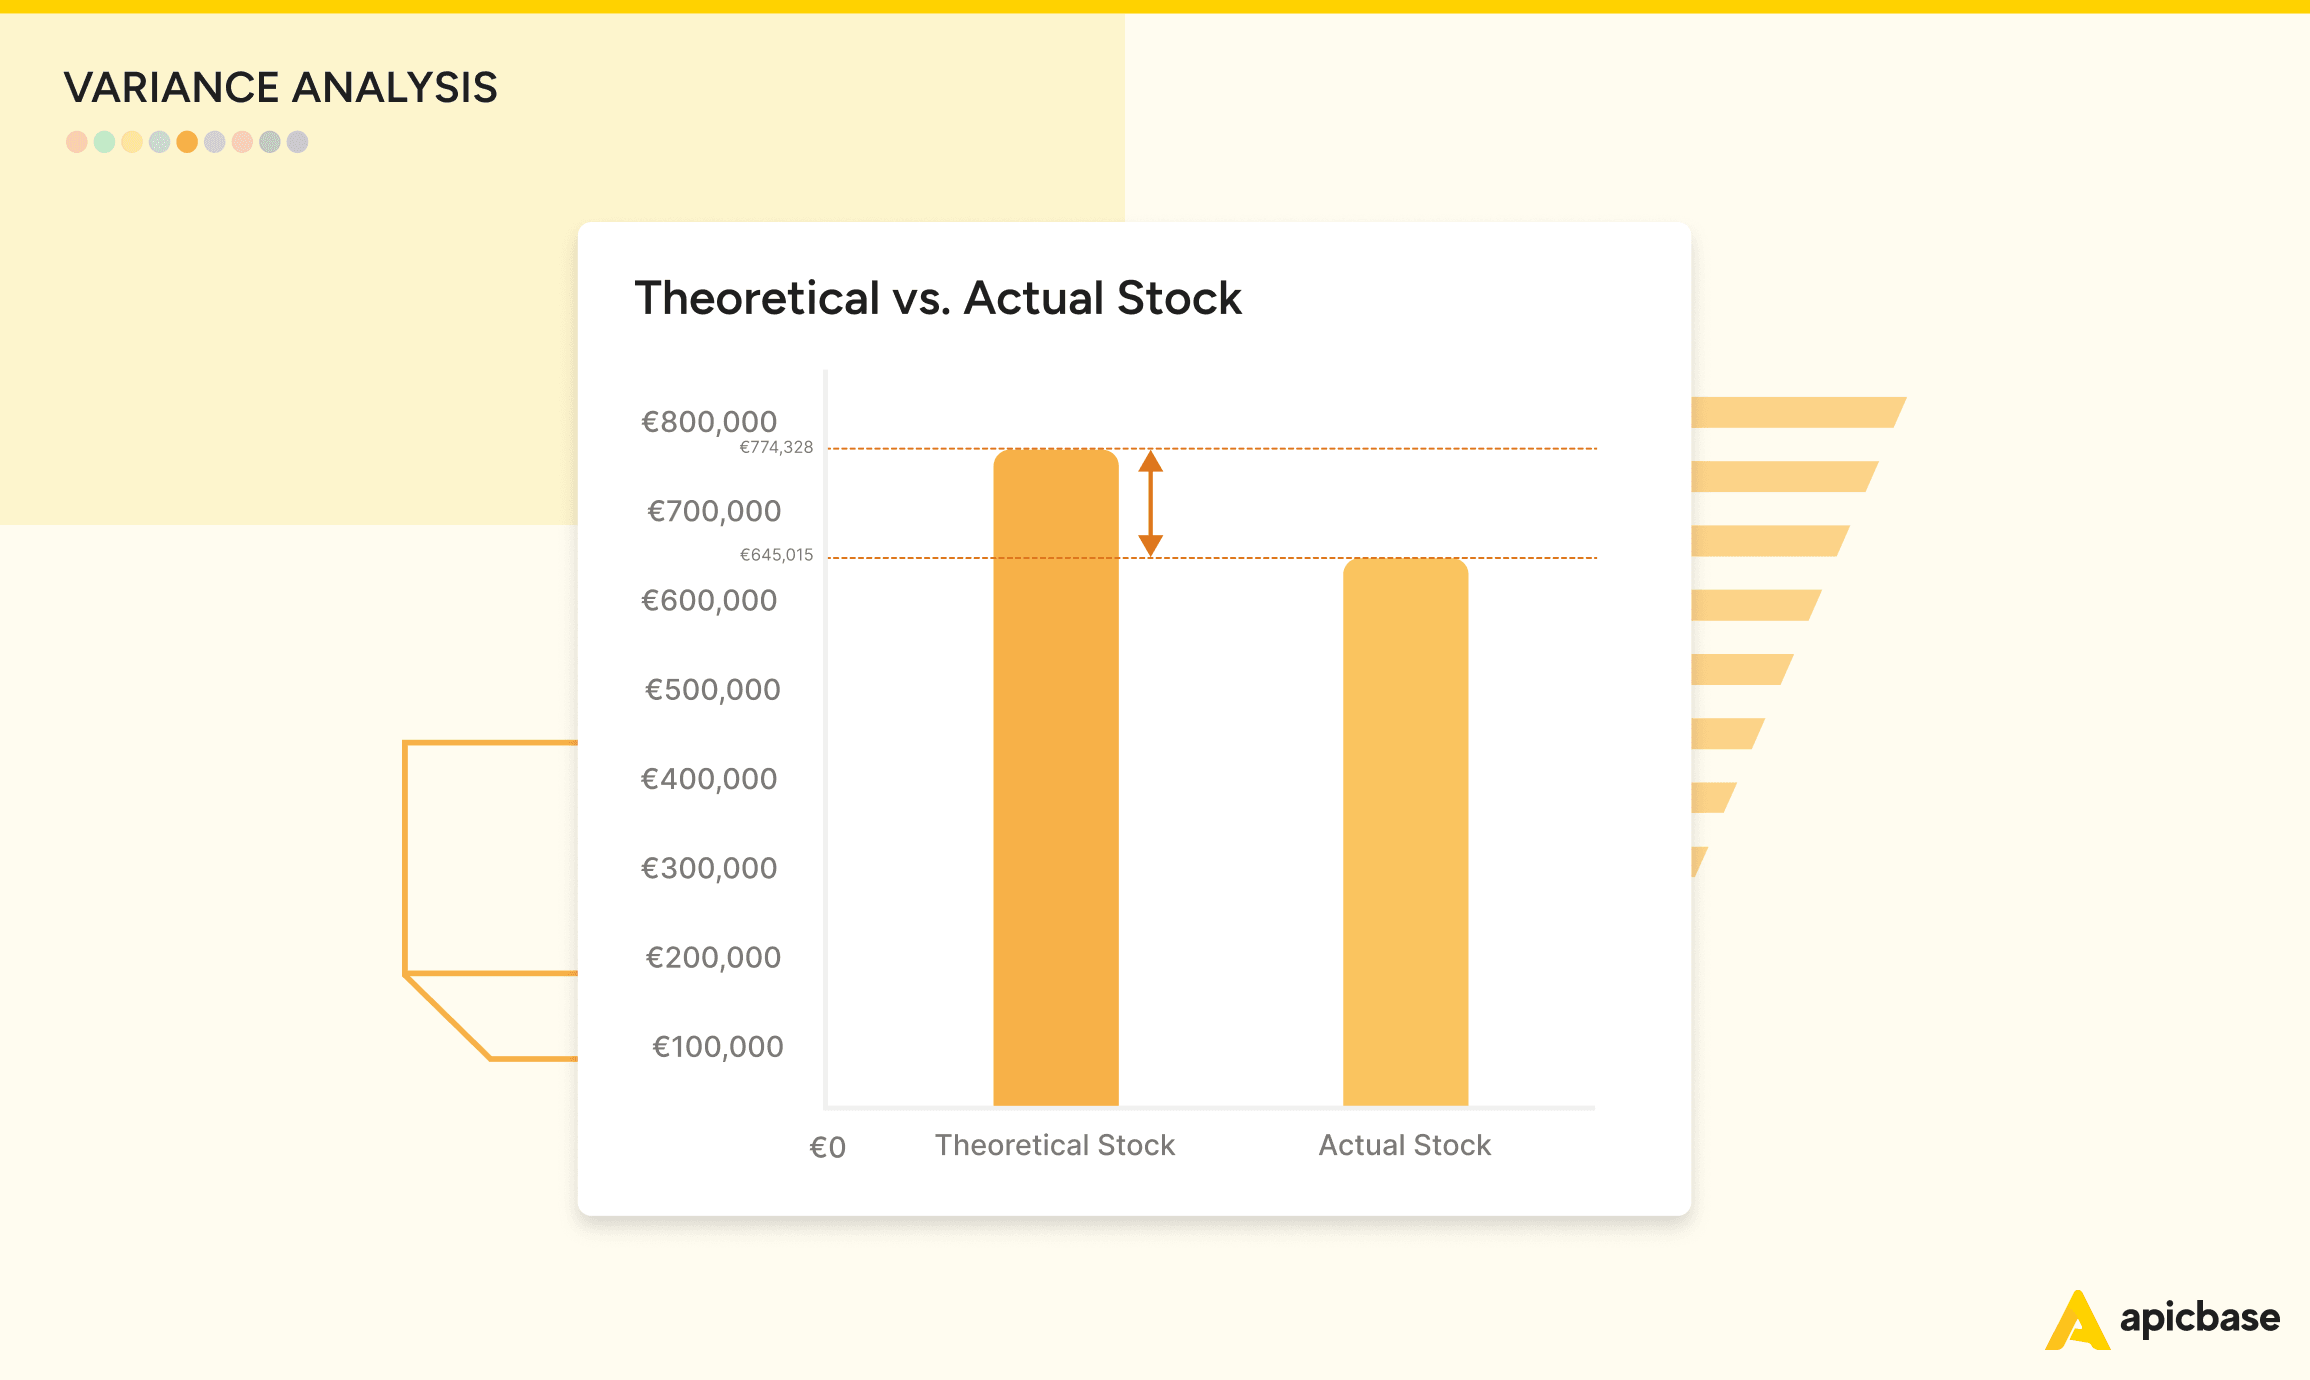
Variance reports tell you the differences between your actual and expected inventory levels and food costs. These figures are vital because they tell you how far the actual numbers are from the forecasted or expected numbers.
Identifying these variances is key to pinpointing waste and inefficiencies within your operations. With a clear understanding of the variance, you can begin to make targeted improvements to minimise these gaps and optimise efficiency, ideally bringing the variance as close to zero as possible.
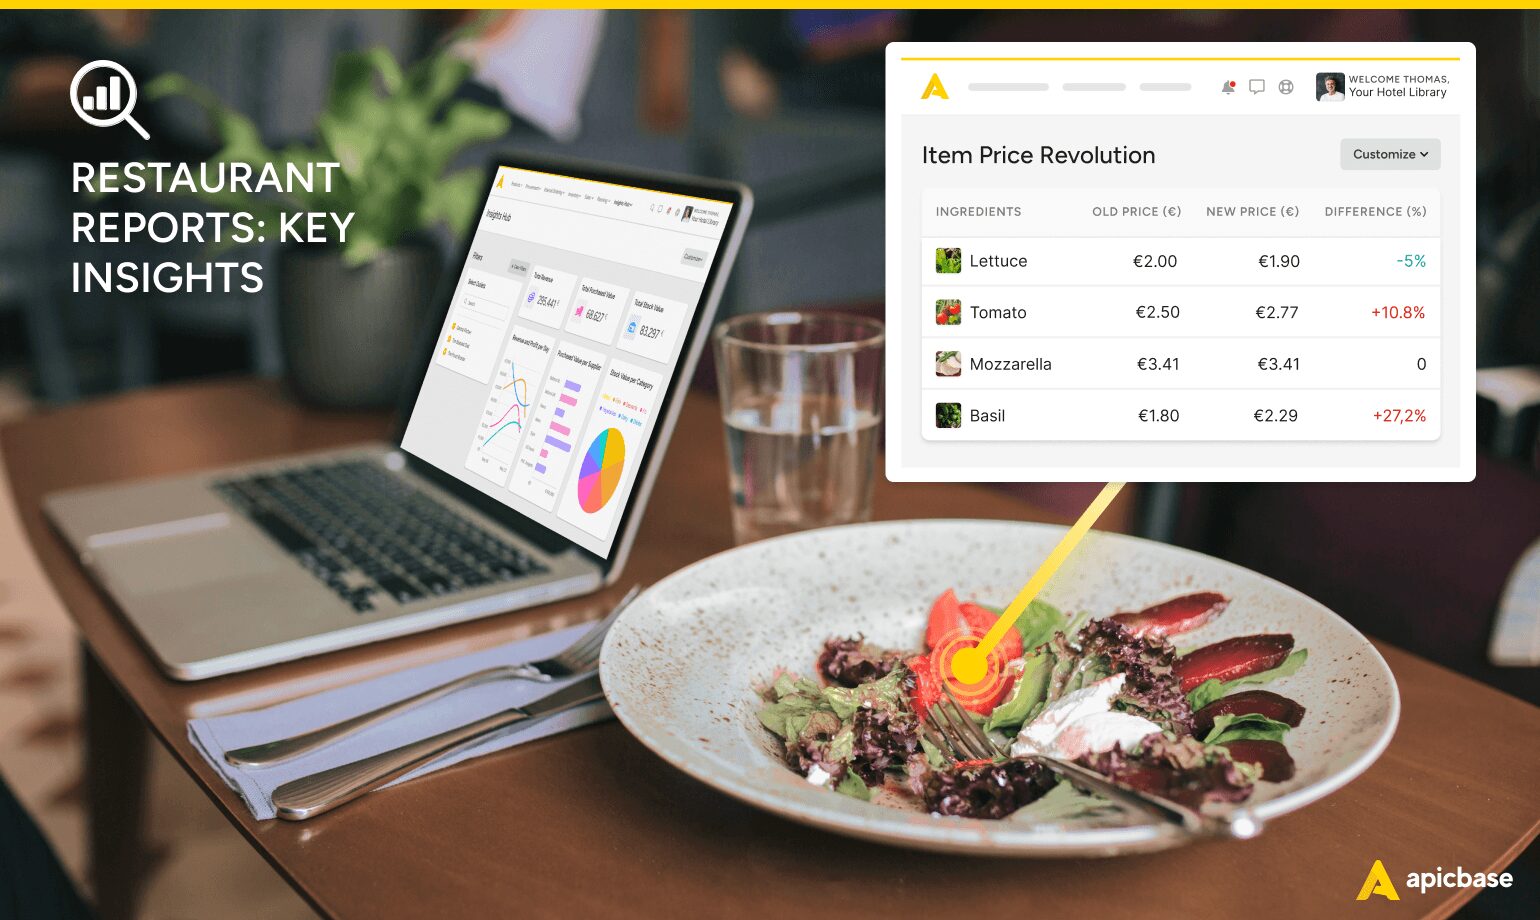
Price Evolution
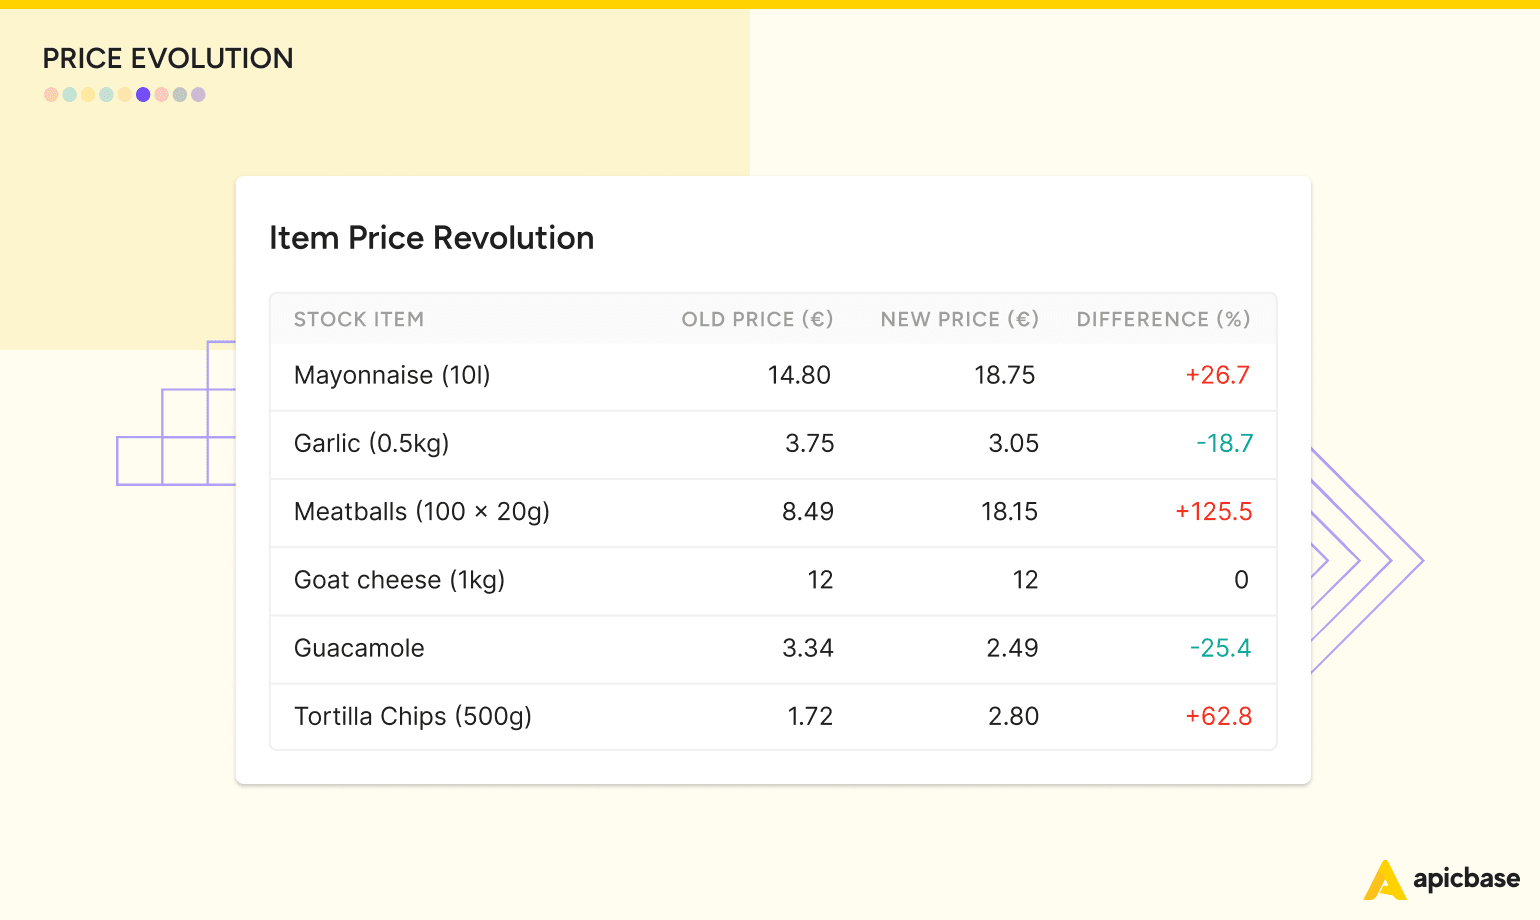
Price evolution reports provide a table that tracks the prices of your ingredients over time, making it easy to spot anomalies or significant supplier price increases quickly. With this information, you can negotiate better prices, consider switching suppliers, or alter recipes to enhance your dishes’ profit margins. This proactive approach helps you manage costs effectively and maintain profitability.
When combined with sales trends reports and menu engineering tools, price evolution reports become powerful tools for optimising menu offerings and boosting the bottom line. They enable data-driven decisions on pricing, supplier choices, and menu development so that your menu is attractive to customers and financially sustainable.
Delivery Values per Supplier
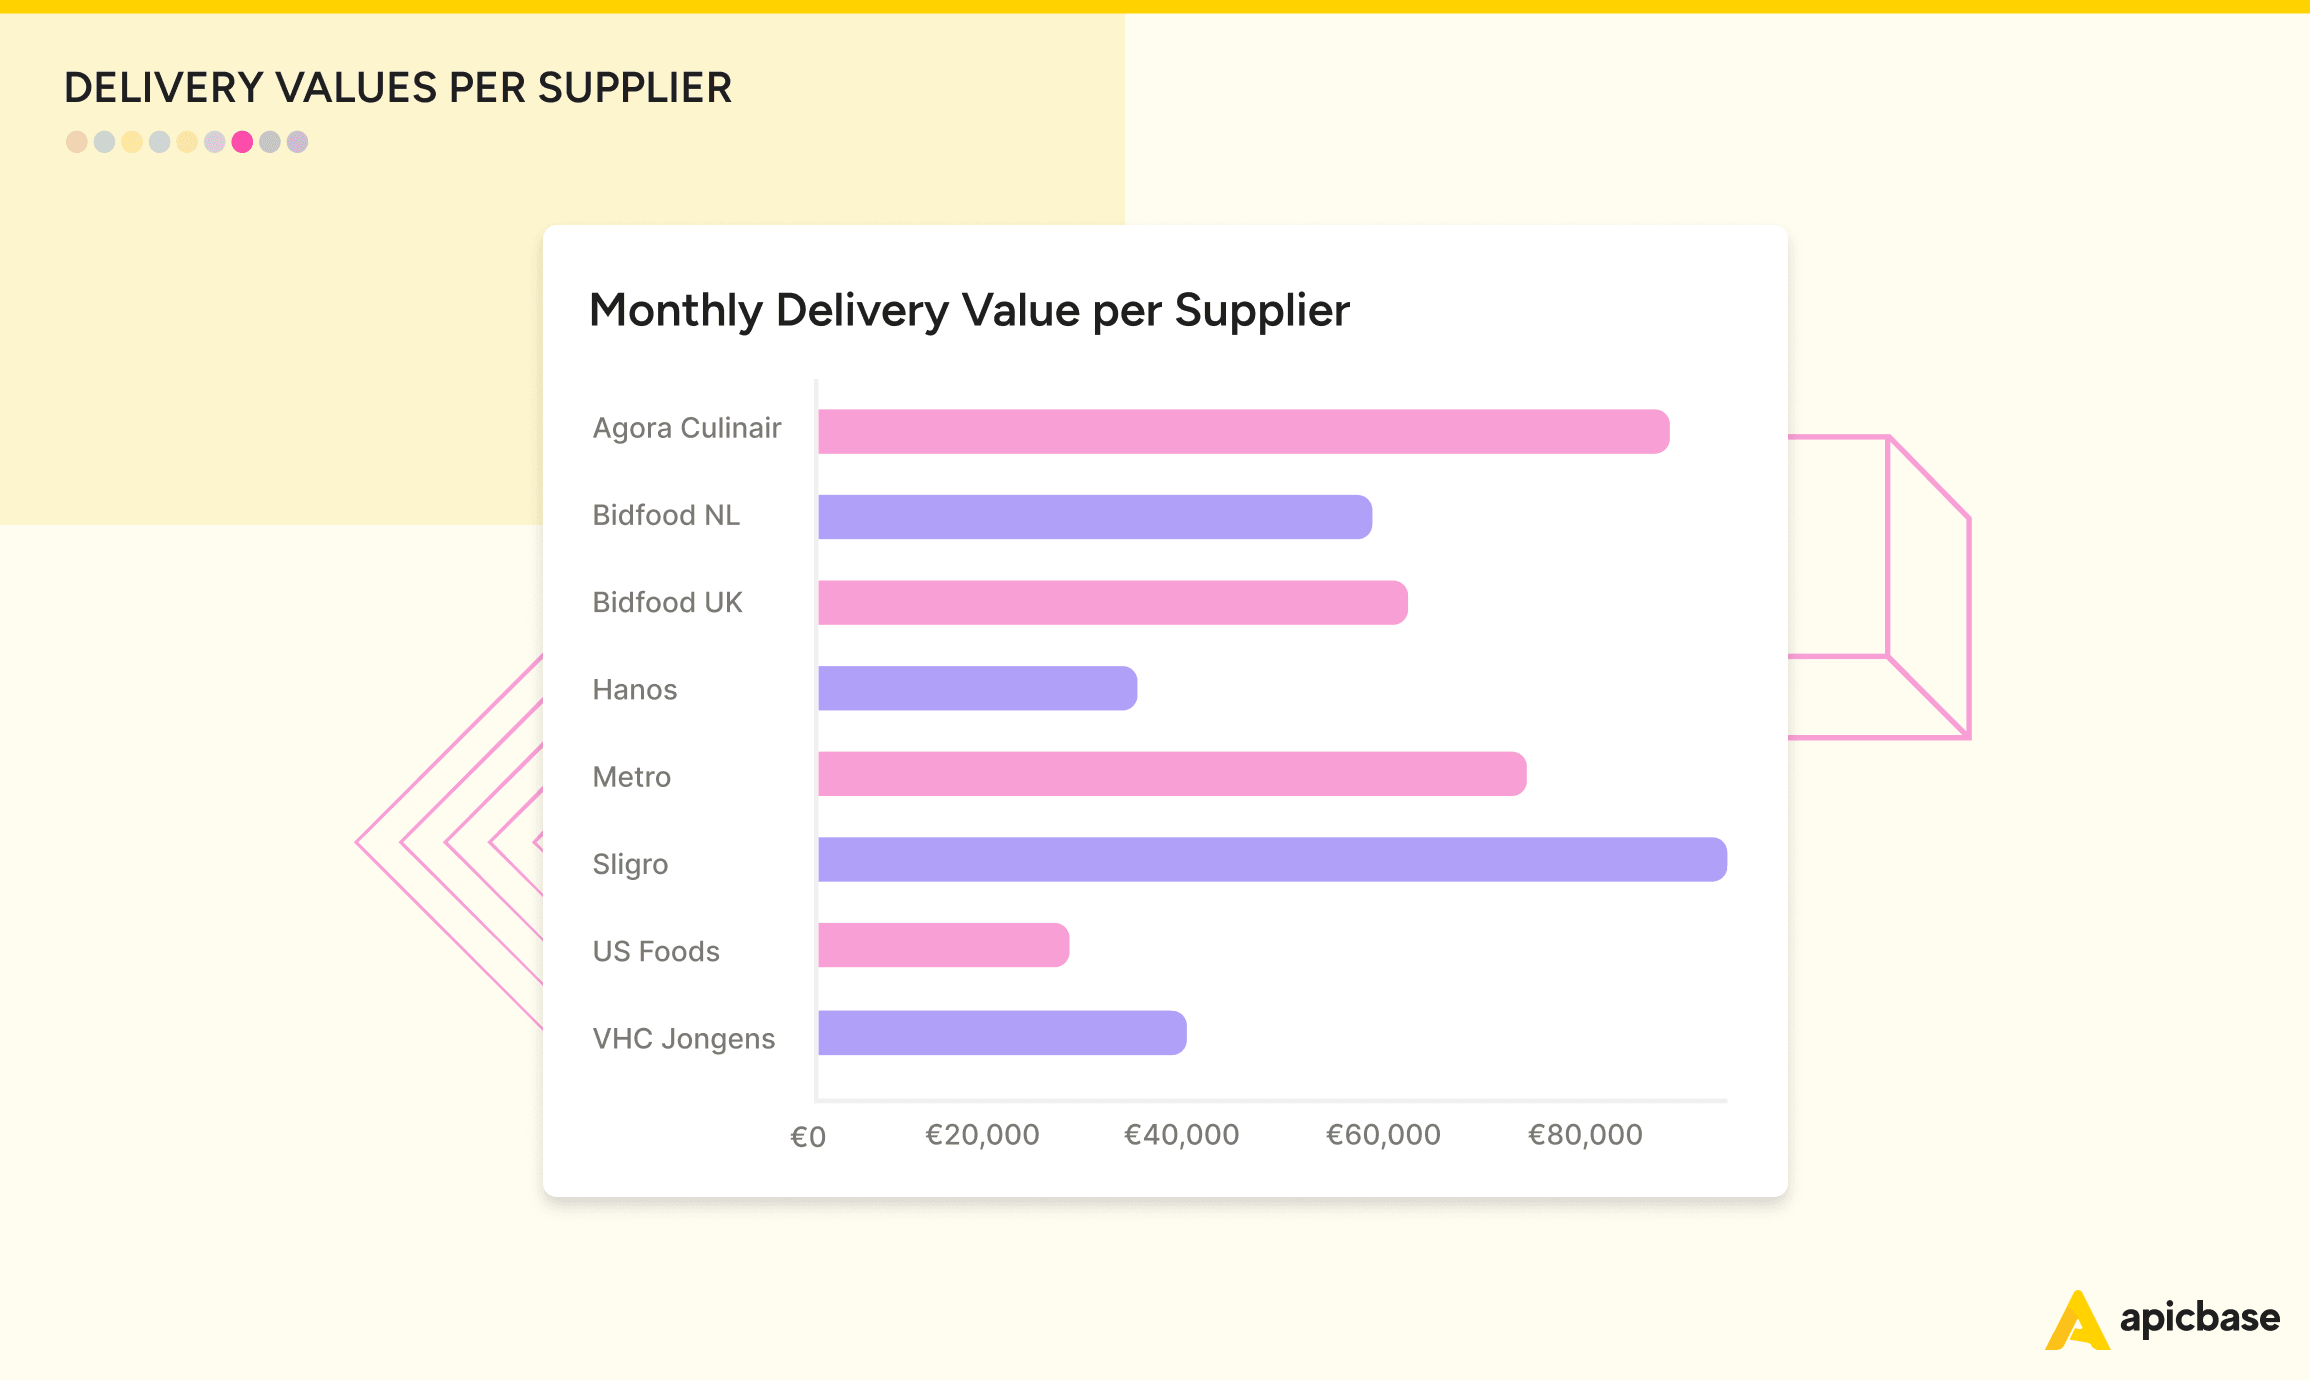
Monthly reports on delivery values let you monitor the cost of ingredients per order. These reports can help you identify opportunities to negotiate better deals, especially when orders from a supplier reach a certain cost threshold.
Additionally, if you find that the delivery costs for a particular supplier are consistently high, you can use this data to work on reducing food costs and minimising food cost variances.
Profits per POS Category
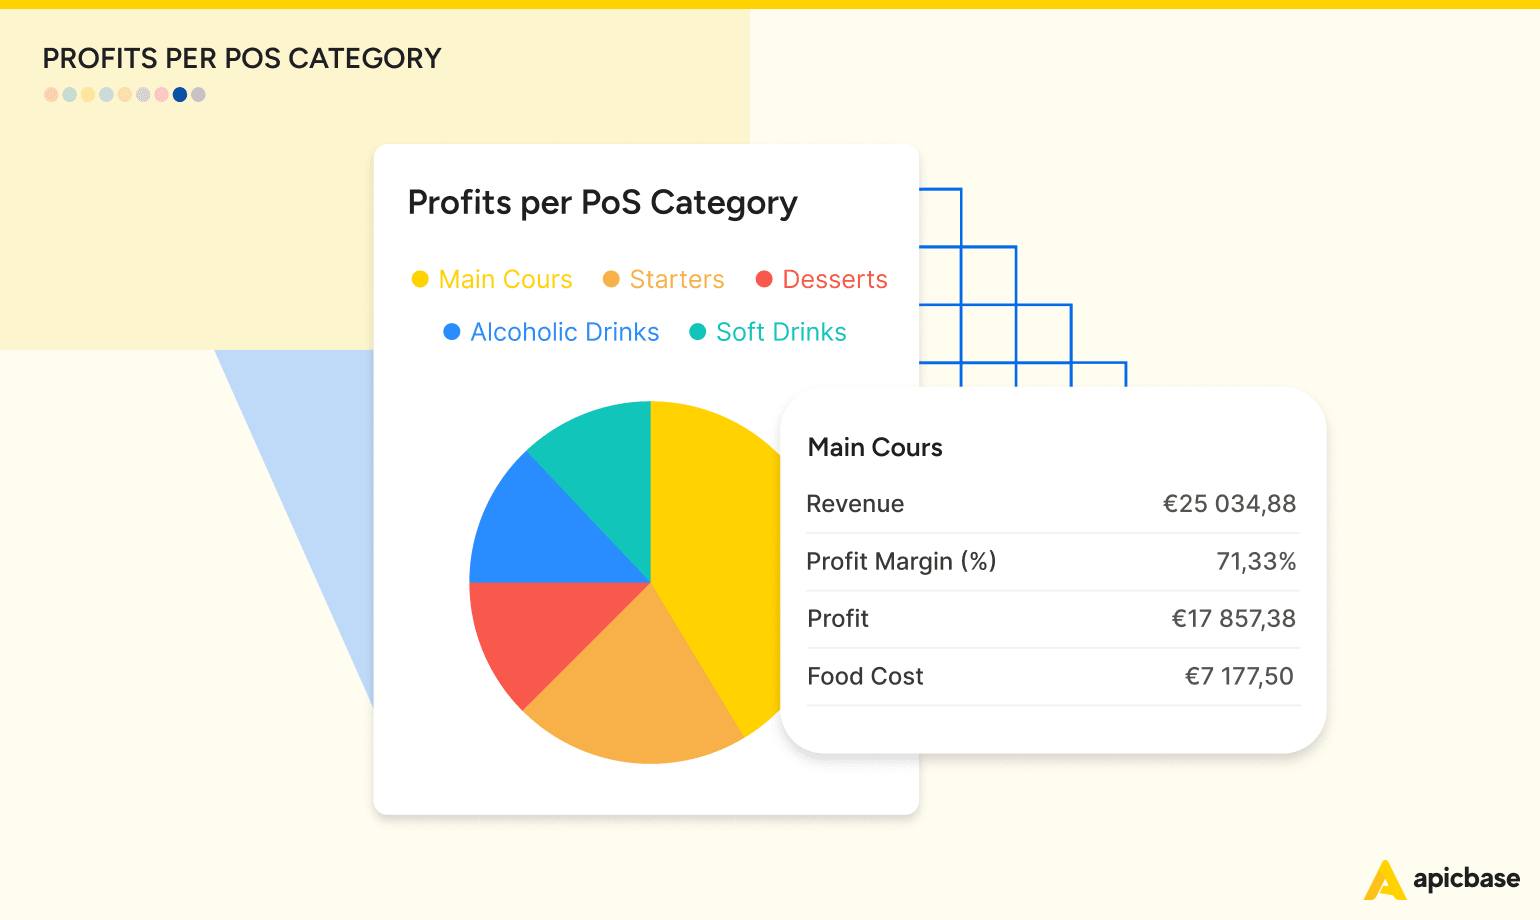
Your POS system is a rich source of data that, when integrated with your back-of-house restaurant management systems, can provide invaluable insights. A crucial analysis from your POS is the profit per category report, which typically includes categories like starters, mains, desserts, sides, alcoholic drinks, hot drinks, and soft drinks. By examining the sales and profit contributions of each category, you can identify opportunities to refine the menu. For example, if desserts sell well but have low-profit margins, this might indicate high costs or pricing problems.
Cost of Goods Sold
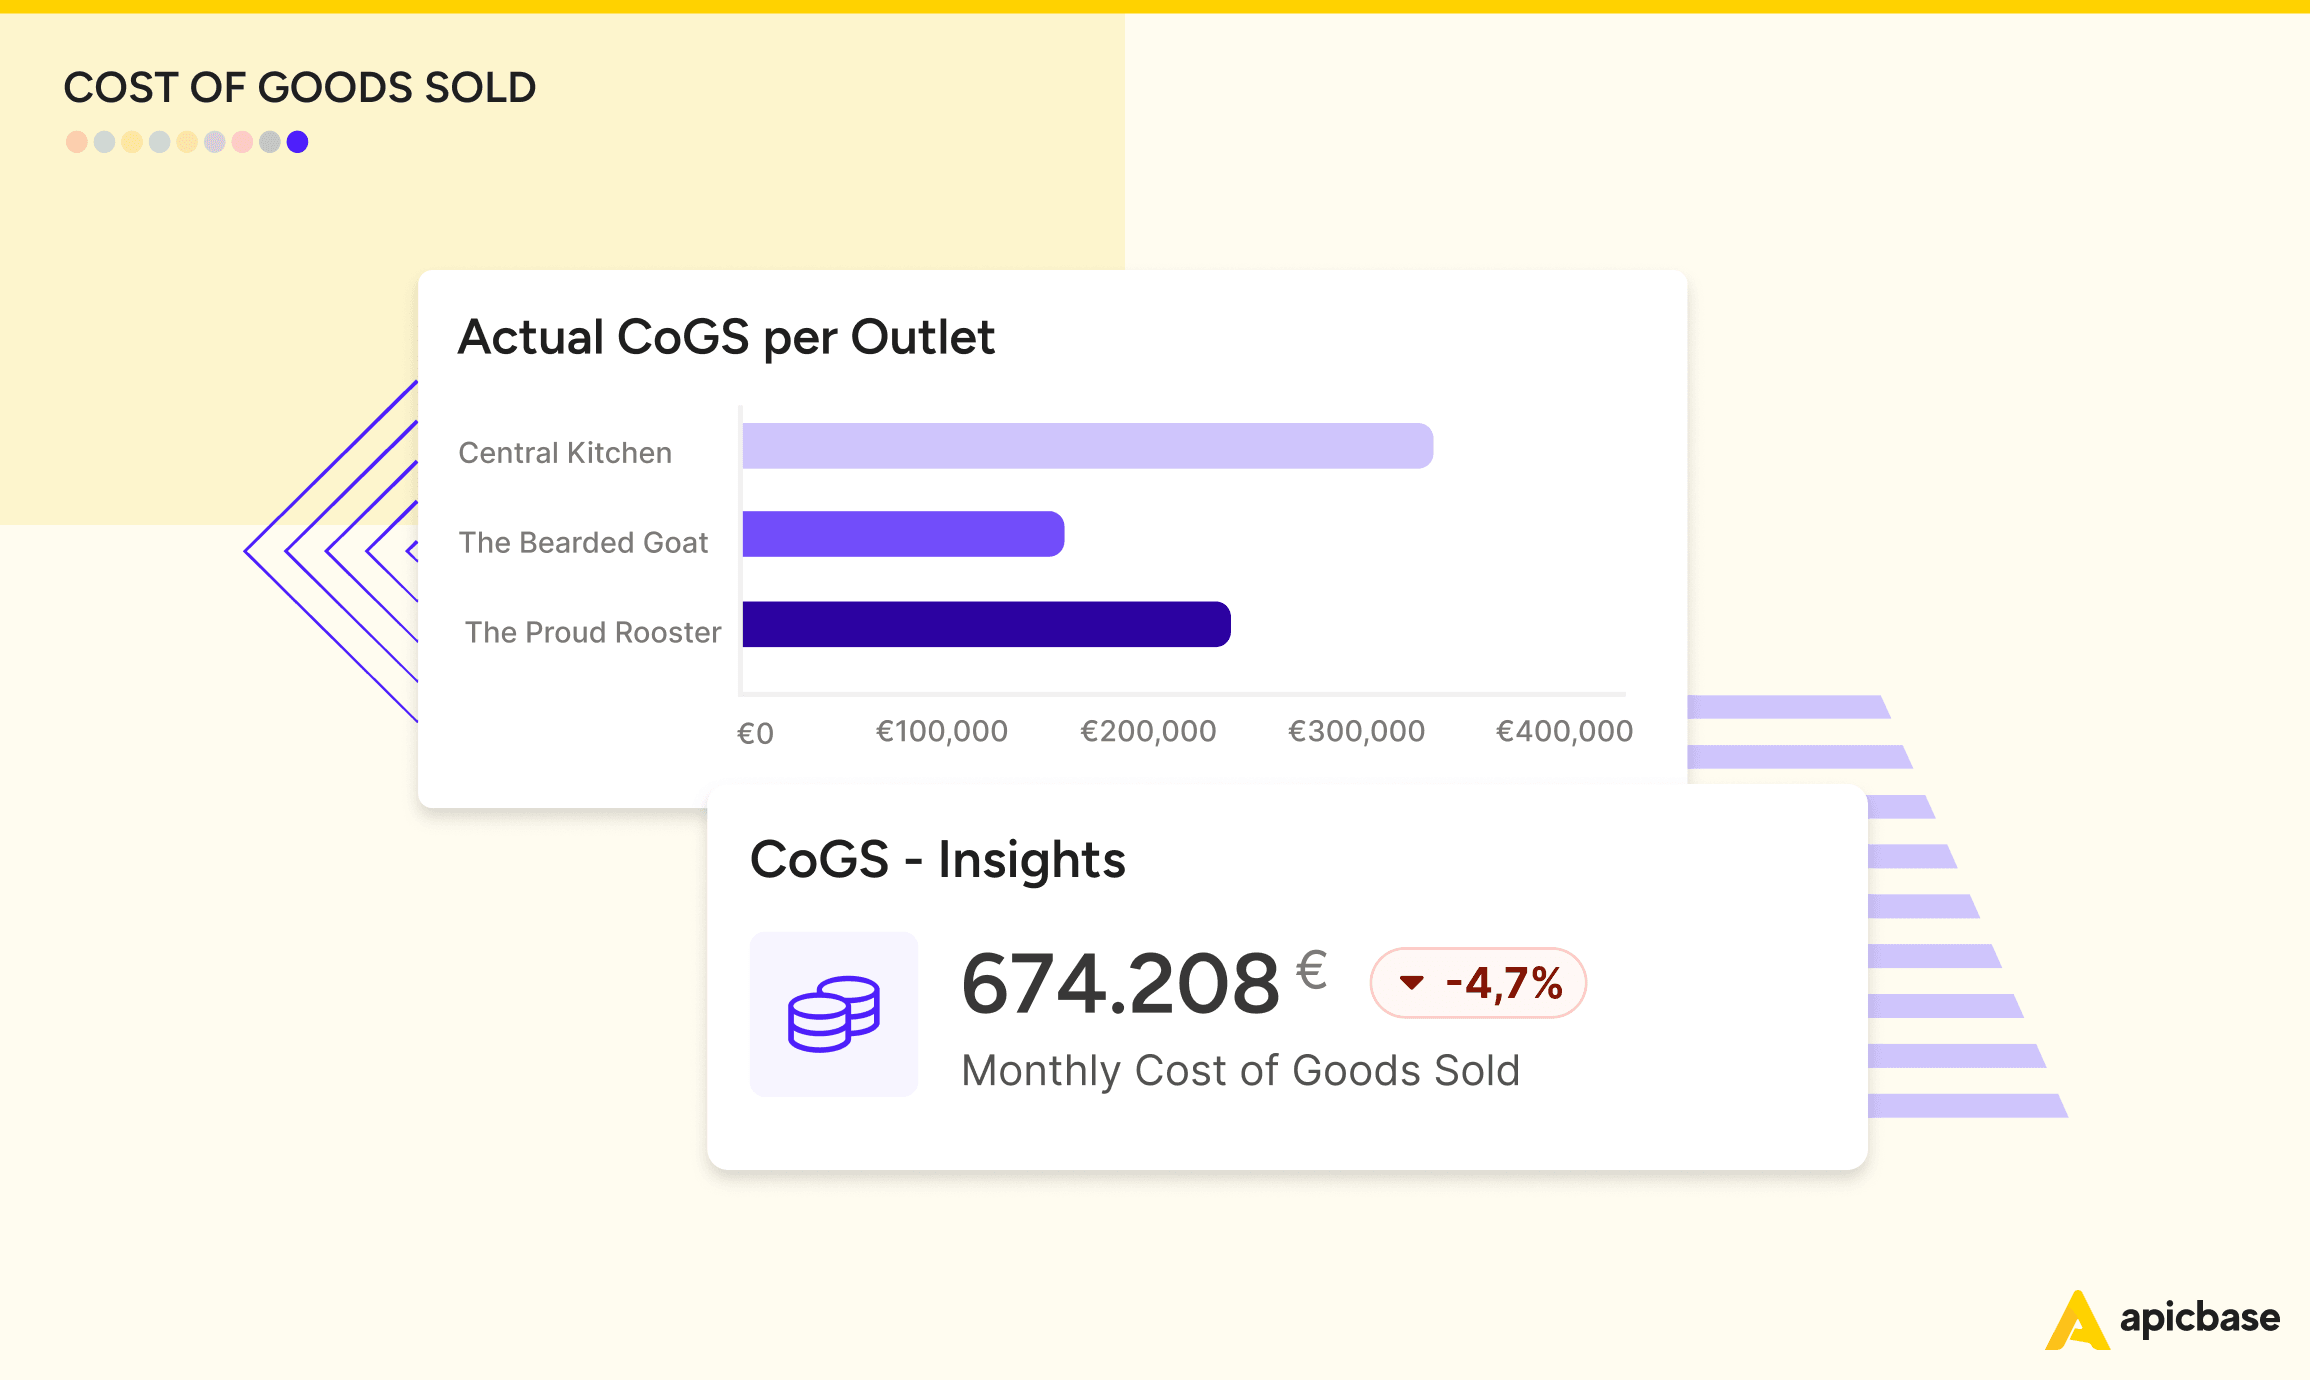
Cost of Goods Sold, or CoGS, is more than just a line item on your financial statements—it’s a critical compass that guides your restaurant’s profitability. This restaurant metric sums up the cost of ingredients and labour needed to create your dishes. Having a clear, detailed CoGS report at your fingertips allows you to see precisely what each menu item costs to produce. It’s an insight that directly affects your pricing strategies and menu design. Unlike P&l, you don’t have to wait months. Software that can generate detailed COGS reports lets you see at any time whether your menu items are still profitable, so you can effectively mitigate any revenue losses.
Apicbase Simplifies Complex Operations Across Multiple Locations
Apicbase transforms overwhelming amounts of raw data into clear, actionable insights with easy-to-understand tables, charts, and graphs.
These insights are vital for monitoring your restaurant’s health and making informed decisions. This is especially true when managing multiple restaurant locations and concepts.
Fragmentation and data silos complicate information retrieval, slows down decision-making, and ultimately limits your potential to improve operations and increase profits, such as reducing food waste.

The Go-To Tech Solution for Multi-Unit Restaurants and Large-Scale Foodservice Operations
Apicbase addresses data-overwhelm head-on with an all-in-one solution that integrates inventory, recipe, cost and performance management into a unified system.
Apicbase is your definitive source of truth, generating all the critical reports we’ve discussed.