Food cost control is the process of managing all factors that influence food costs in your restaurants, so that the difference between what you should be spending on food and what you actually spend can be monitored and addressed.
Food prices are high. Nearly 95% of operators cite food costs as a significant challenge, 42% weren’t profitable last year. And food-away-from-home inflation is running above the 20-year average.
You have no control over food prices. But what you can control is everything that happens once ingredients enter your business. For this, you need a control system.
What is food cost control?
Food cost control is the system that keeps your restaurant’s food spend aligned with its targets.
The system involves standardised recipes, measuring inventory usage, and monitoring procurement. Every element in the chain — from recipe design to the plate reaching the guest — needs to work in sync.
A systematic approach typically results in savings of 5 to 6% on food costs, which – depending on the size of your business – can increase gross margin by millions a year.
Cost-cutting is not the same as food cost control. Cost-cutting is reactive: renegotiate a contract, shrink a portion, swap an ingredient. These tactics work, but they are one-offs. A control system is ongoing. It ensures compliance with SOPs (standard operating procedures), catches problems before they compound, and ensures the improvements you make today hold up next month.
The KPI (key performance indicator) that powers this cycle of continuous improvement is food cost variance. It reveals the gap between what your recipes indicate you should have spent on food during a given period (theoretical food cost) and what your restaurants actually spent (actual food cost).
What should food cost be in a restaurant?
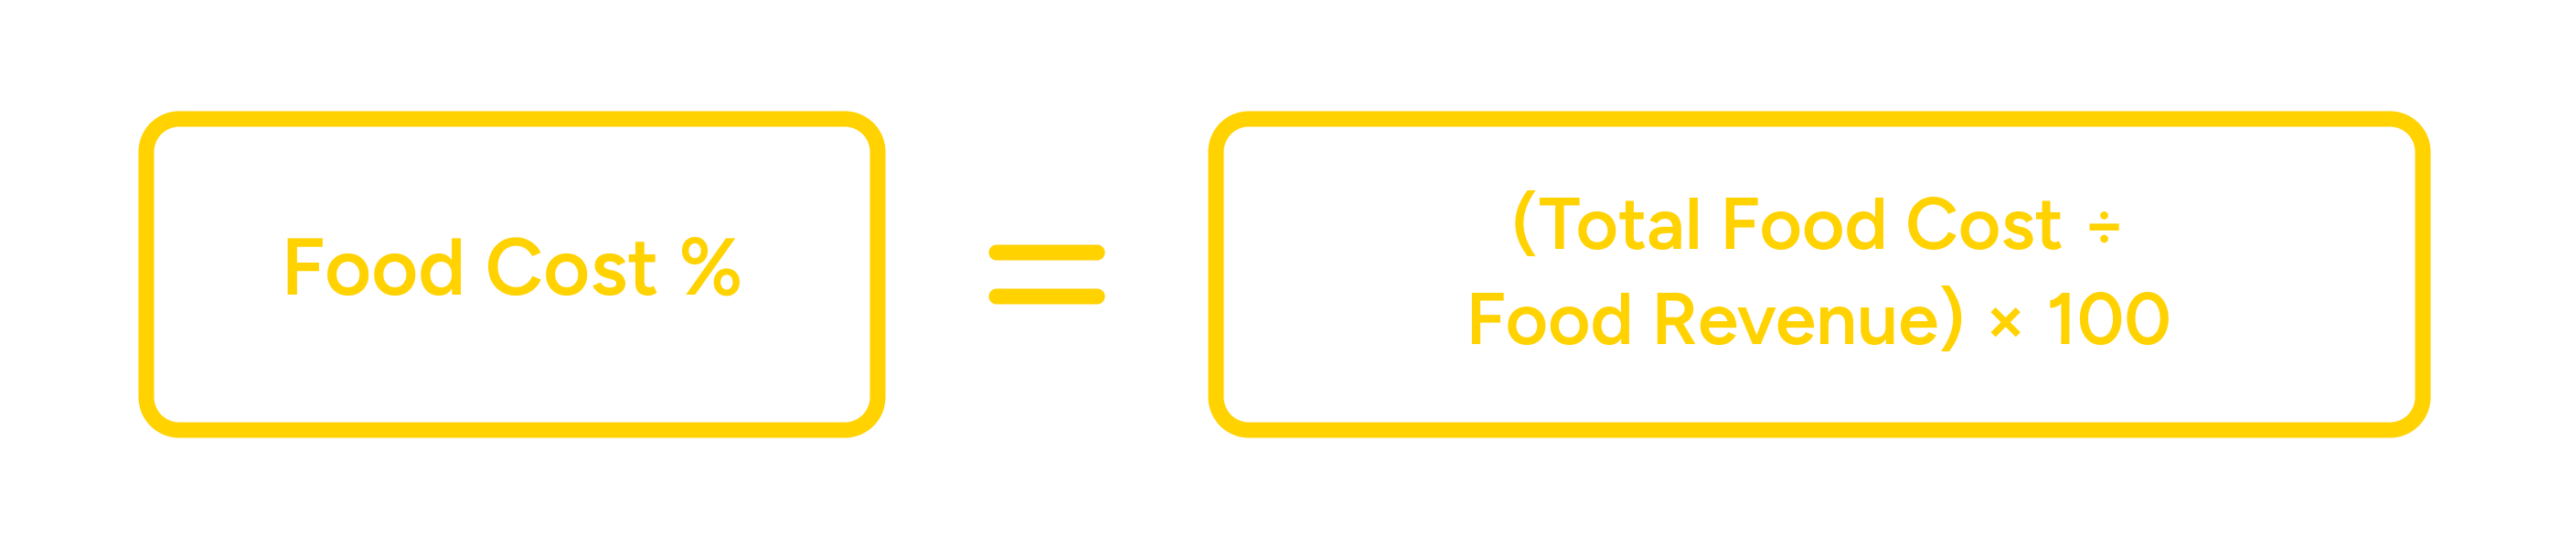
The formula for food cost percentage is total food cost divided by food revenue multiplied by hundred.
If you’ve looked this up before, you’ve probably seen “28–35%” quoted as the standard. It’s a starting point, but it’s misleading without context. Food costs vary significantly by segment, and what’s healthy in one format can be alarming in another.
| Segment | Typical food cost % | Why it varies |
|---|---|---|
| QSR | 20–25% | Standardised menus, bulk purchasing, minimal waste |
| Full-service restaurants | 28–35% | Wider menus, complex prep, perishable ingredient profiles |
| Hotels | 35% food | Multiple outlets spread cost; room revenue cross-subsidises F&B margins |
| Contract catering | 35–40% | Margins locked by contract — control protects committed profitability |
| Fine dining | 35%+ | Premium ingredients justify a higher cost; margin comes from beverages and experience |
Sources: HC-Resource 2025 Benchmark Report, VantaInsights 2026, CBRE Hotel F&B 2025.
These numbers are orientation. They tell you whether you’re in the right ballpark for your segment. They’re not the number you should be managing against.
Your real benchmark is your theoretical food cost — the number your own recipes produce, at your current supplier prices, for your actual sales mix. That’s the only number worth comparing your actual cost against, because it reflects your operation, not an industry average.
Why is my food cost so high?
When food costs run above target, the cause is rarely one thing. It’s usually a combination. The six most common causes of high food cost in restaurants are over-portioning, recipe non-compliance, supplier price drift, unrecorded waste, inventory counting errors, and untracked transfers between sites.
Over-portioning
Over-portioning is the most common and often the most expensive. Even small deviations add up fast. Independent case studies in Europe have found that restaurants can save up to €30,000 per year per location by tightening portion sizes and stock management. If your kitchen is eyeballing portions, you’re almost certainly over-serving on your highest-cost ingredients.
Recipe non-compliance
Recipe non-compliance is the silent version of the same problem. The recipe says 150g of salmon; the chef uses 180g because that’s what looks right, or because the recipe card hasn’t been updated in months. When recipes aren’t the single source of truth — when they live in binders, spreadsheets, or people’s heads — each site gradually develops its own version of every dish.
In Apicbase, every kitchen works from the same digital recipe, with gram-level specs, sub-recipes, and allergen data in one place. When a recipe changes, every site sees the update immediately.
Supplier price drift
Supplier price drift happens when ingredient prices change, but nobody updates the costings. As the F&B director of a hotel group described it: “There are periods of months when we’re working on an old costing for a dish, it haemorrhages money really.” Your theoretical cost drifts from reality, and every margin calculation based on it becomes unreliable.
Unrecorded waste
Unrecorded waste, product that’s thrown away without being logged, creates a gap between what your inventory system thinks you have and what’s actually there. Until waste is tracked systematically, it’s invisible in your data.
Inventory counting errors
Inventory counting errors feed the same problem. If counts are inaccurate — because of inconsistent units, rushed counts, or untrained staff — your actual food cost number is unreliable, which makes your variance meaningless.
Untracked transfers
Untracked transfers between sites are a multi-site-specific issue. When a product moves between locations without being recorded, one site’s inventory looks inflated, and another’s looks short. Neither site’s food cost is accurate.
Apicbase logs inter-site transfers as they happen, both the sending and receiving sites’ stock updates automatically, keeping variance data clean on both sides.
All six causes create a gap in food cost. Food cost variance analysis identifies the cause driving the problem at each site, so you can fix the right thing instead of guessing.
There is a seventh cause: bad data
Bad data doesn’t inflate your food cost, but it hides everything that does. When recipe cards show last month’s supplier prices, inventory counts are inconsistent, or deliveries are booked against the wrong location, your variance number stops meaning anything. A robust system that holds your core F&B data is the main component for reliable food cost management.
How do you control food cost in a restaurant?
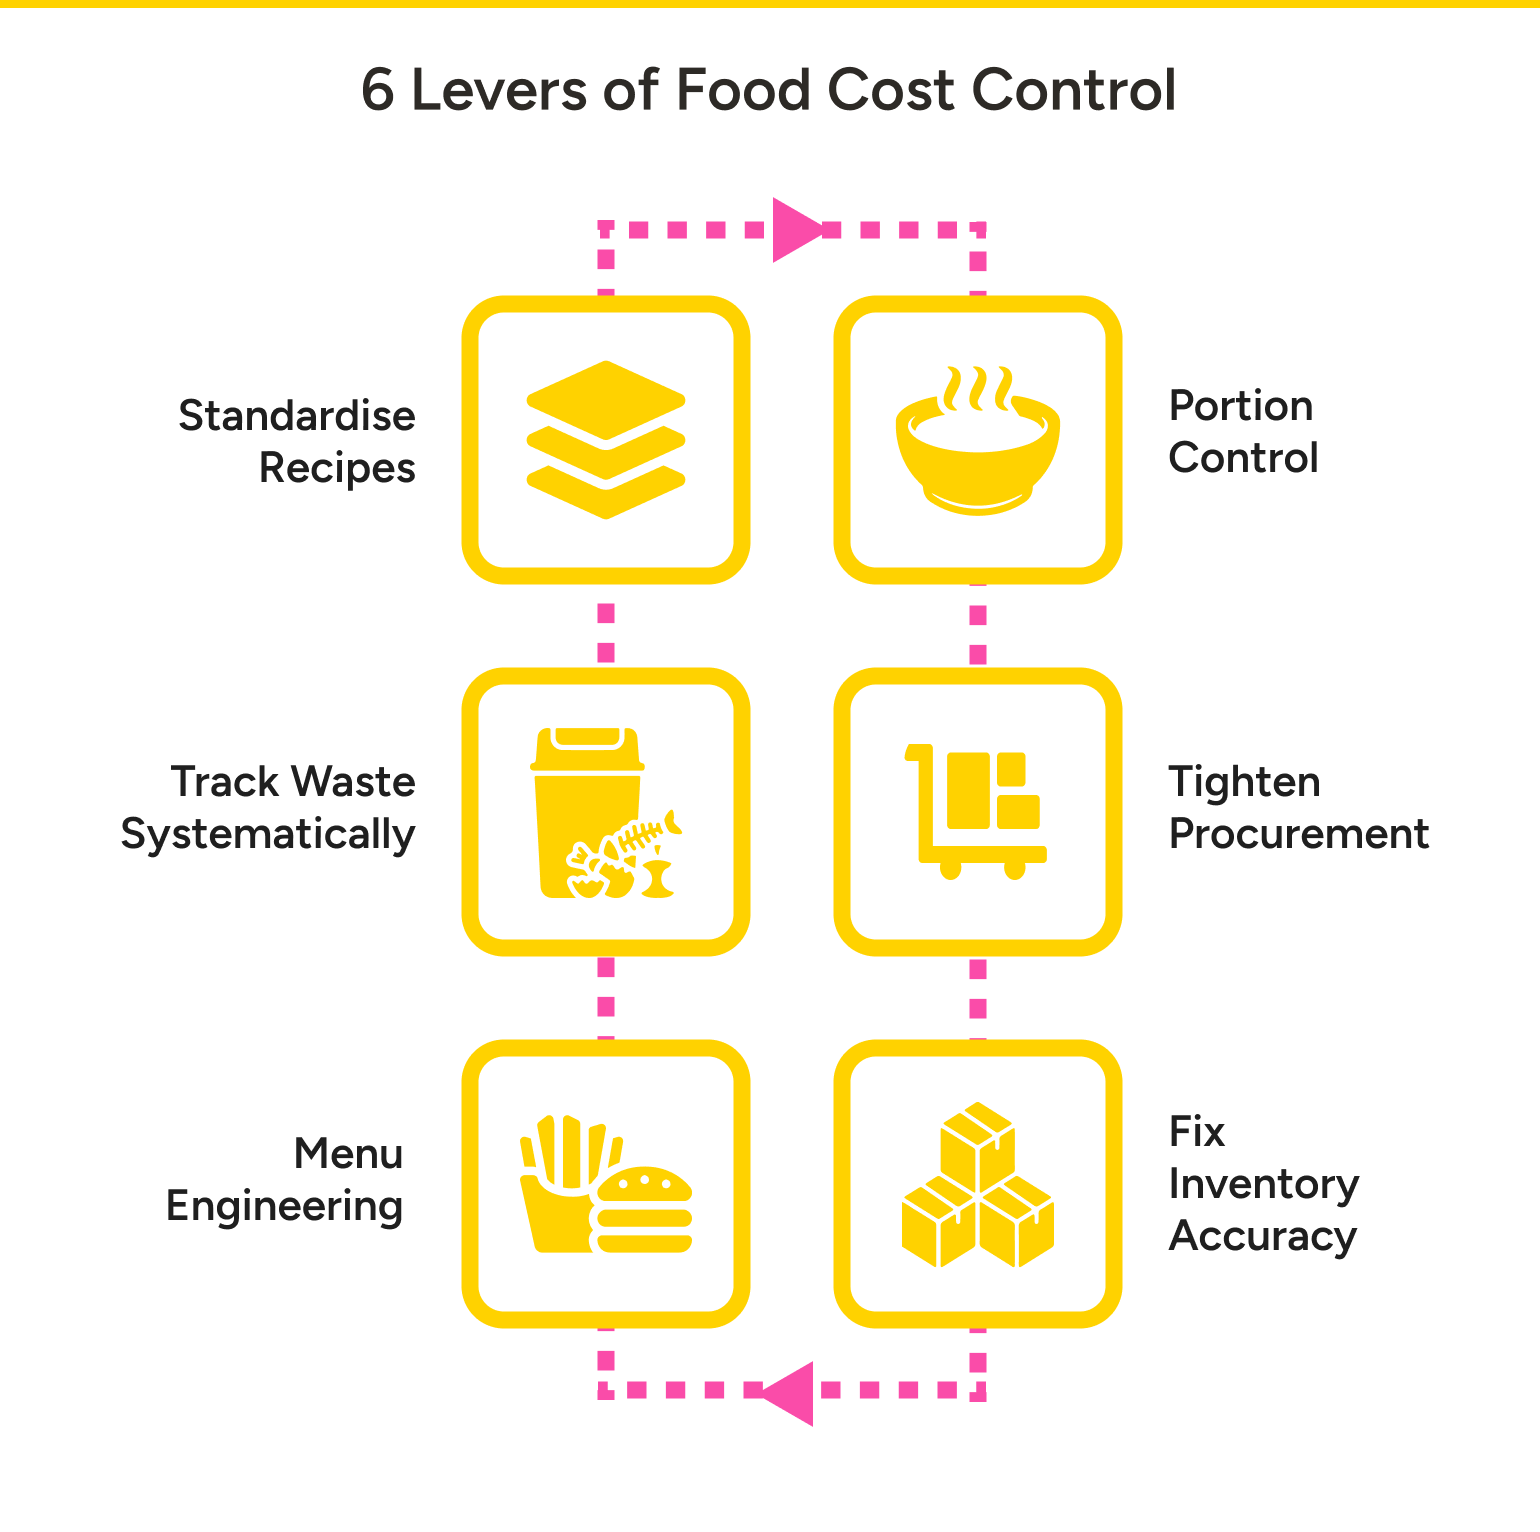
There are six levers for controlling food costs at your sites. The levers, in order, are recipe standardisation, portion control, procurement discipline, inventory accuracy, menu engineering, and waste tracking. They work in sequence; each one depends on the previous one.
1. Standardise your recipes: the foundation of food cost control
Everything starts here. If your recipes aren’t standardised, costed, and accessible to every kitchen, nothing else works reliably. You can’t calculate theoretical food cost without accurate recipe data. You can’t measure variance. You can’t enforce portions.
Standardisation means getting recipes into a single system — “not five different spreadsheets, not Google Drive, not knowledge sitting in specific persons,” as Andreas Wehler put it — and designing them with cost in mind. Reusing the same base ingredients across multiple dishes reduces your SKU count, simplifies purchasing, improves volume leverage with suppliers, and reduces waste from slow-moving ingredients.
In Apicbase, when a supplier price changes, every recipe that uses that ingredient updates automatically — no manual recalculation, no stale costings. Recipe costing software turns this from a quarterly spreadsheet exercise into a live, always-current process.
2. Enforce portion control
Once recipes are standardised, the next lever is making sure the kitchen actually follows them. Digital portion scales, visual portion guides, and regular portioning audits keep protein costs — your most expensive ingredient category — from creeping up. Restaurants that maintain recipe‑level portion accuracy typically recover 2-5 percentage points of gross margin that would otherwise leak out as food cost.
3. Tighten procurement discipline
This is where money leaks quietly. Without centralised purchasing, each site orders from whichever supplier they’re used to, at whatever price they get. One Apicbase customer, a Scandinavian chain, discovered they were paying 21 kronor per litre for milk (€1.94) that was available for 12.50 (€1.15), that’s 110,500 kronor (€10.206,77) per year on a single ingredient across 13,000 litres.
Procurement discipline means approved supplier lists, centralised ordering, and three-way invoice matching (comparing the purchase order, the delivery note, and the invoice to catch discrepancies). It also means visibility into what’s being ordered across all sites, so you can consolidate volumes and negotiate from a position of knowledge.
As Tosca Eggenhuizen at CitizenM described the old state: “No structure to control if we weren’t overpaying suppliers. Staff ordering per supplier, walking through the hotel multiple times for each vendor.”
In Apicbase, procurement flows from the recipes: the system suggests orders based on what’s needed, routes them to approved suppliers, and flags invoice discrepancies against the original PO and delivery note. This three-way match happens automatically.
4. Get inventory accuracy right
Your actual food cost is only as reliable as your stock counts. If the count is wrong, the variance is meaningless, and you’re making decisions on bad data.
The key is counting cadence and consistency. High-value, fast-moving items — proteins, dairy — should be counted daily or per shift. Everything else weekly. Standardise units and pack sizes across staff. And invest in tools that make counting faster and less error-prone.
In Apicbase, staff count by voice — scanning a shelf and speaking quantities instead of writing them down — which cuts counting time by 70% while holding 99% accuracy. That turns what one operations manager called “going crazy from all the counting” into a manageable routine. Inventory management that connects counts to recipes and purchasing is what turns raw count data into actionable food cost intelligence.
5. Use menu engineering to shift your sales mix
Once you know what each dish actually costs and how well it sells, you can make smarter menu decisions.
Menu engineering combines POS sales data with recipe-level profitability to show which items are popular and profitable, which are popular but margin-poor, and which should be reconsidered. Shifting your sales mix toward higher-margin dishes improves food cost percentage without cutting a single portion or renegotiating a single contract.
Apicbase pulls this data live from your POS and your recipes. The margin matrix updates as sales come in and ingredient prices change, rather than being a quarterly exercise built from stale spreadsheets.
6. Track waste systematically
Waste is the last lever because it catches everything the other controls miss. Systematic waste logging — recording what’s thrown away, when, and why — turns an invisible cost into a visible one.
A global analysis of 114 restaurants found that sites implementing structured food‑waste‑reduction programs, including measurement and tracking, achieved a median 2‑percentage‑point reduction in the cost of food waste as a share of COGS, with an average benefit‑cost ratio of 7:1.
The National Restaurant Association similarly reports that for every dollar invested in food‑waste reduction, restaurants can realise roughly 8 dollars in cost savings.
In Apicbase, staff log waste with a reason code — overproduction, spoilage, plate return — so you can see not just how much was wasted but why. That data feeds directly into your variance reports.
Beyond the financial upside, waste tracking is increasingly part of ESG and sustainability expectations from regulators and guests, especially in markets where restaurants must disclose waste and environmental impacts.
How do you reduce food cost across multiple sites?
Food cost control at a single site is a management problem. At 50+ sites, it becomes a systems problem.
When you run dozens of restaurants, cost monitoring or reductions shouldn’t depend on individual discipline but on centralised rules that enforce compliance without anyone having to chase it. A recipe update that auto-pushes to 50 kitchens overnight is control. An email asking 50 GMs to print a new spec sheet is hope.
At a single site, a good head chef can keep food costs in line through personal oversight. They know the recipes, watch the portions, and check the deliveries. Scale that to 20, 50, or 200 sites, and personal oversight just isn’t an option anymore.
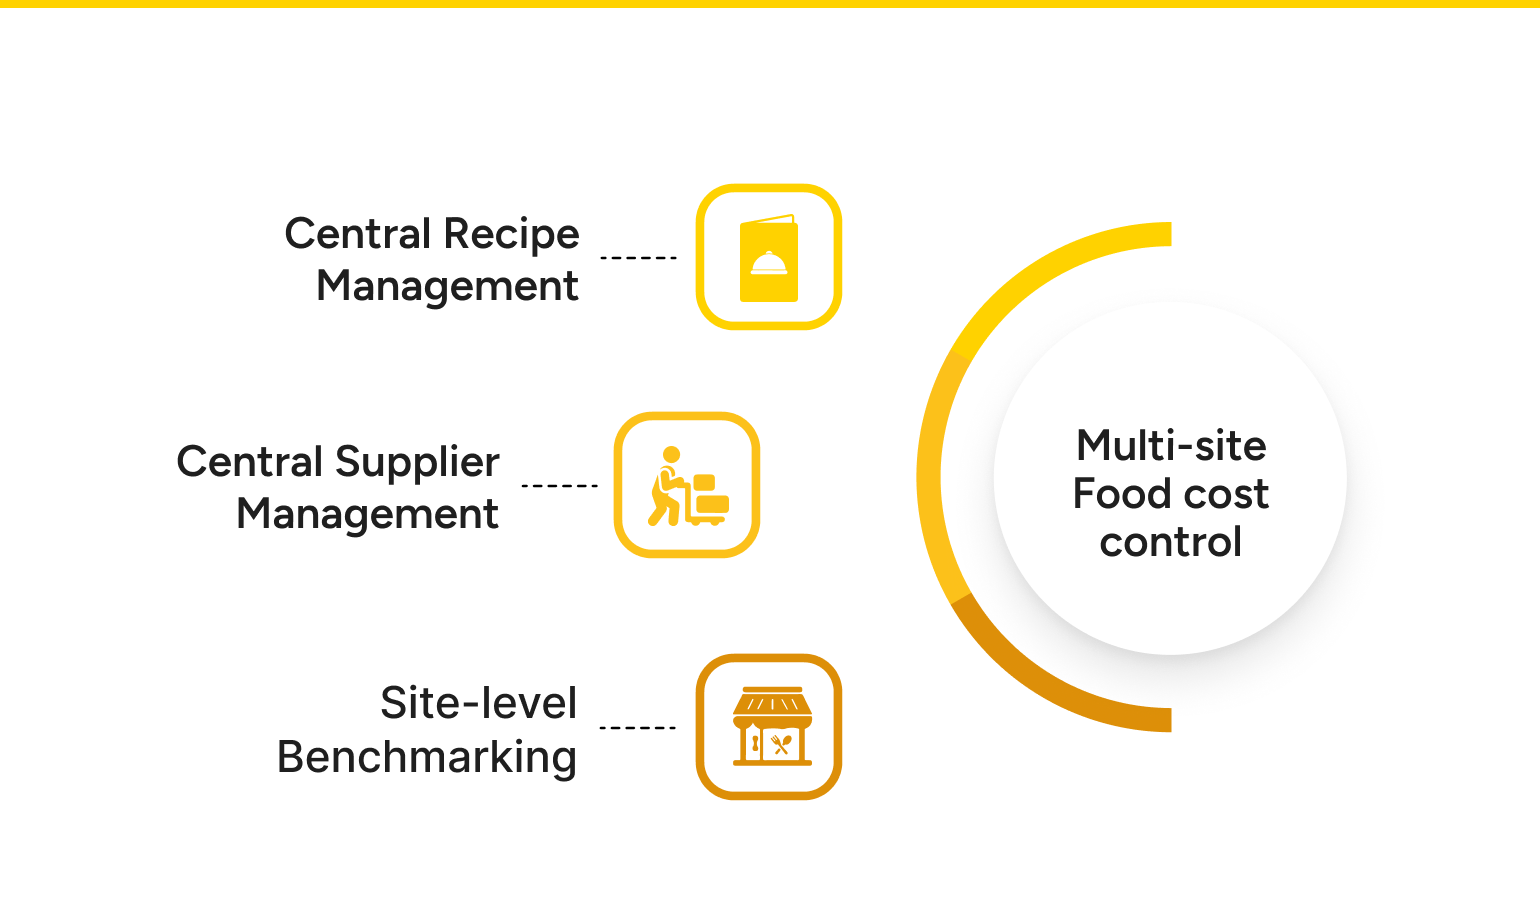
The question becomes: how do you make sure what HQ decides actually happens on every kitchen floor? You need three things.
Central recipe management
Every site works from the same recipes, the same portions, the same ingredient specifications. When R&D updates a recipe, it updates everywhere — not through email chains or laminated cards that take weeks to reach every location.
Supplier centralisation
When procurement is decentralised, rogue ordering is inevitable. Roger Langhout described a common scenario: “Before implementing controls, everyone was ordering from different suppliers based on personal relationships or habit, and there was absolutely no cost control — it was purely ad hoc and uncontrollable.” Centralising approved suppliers and enforcing orders through a single system gives you volume leverage, price consistency, and visibility into spending across the group.
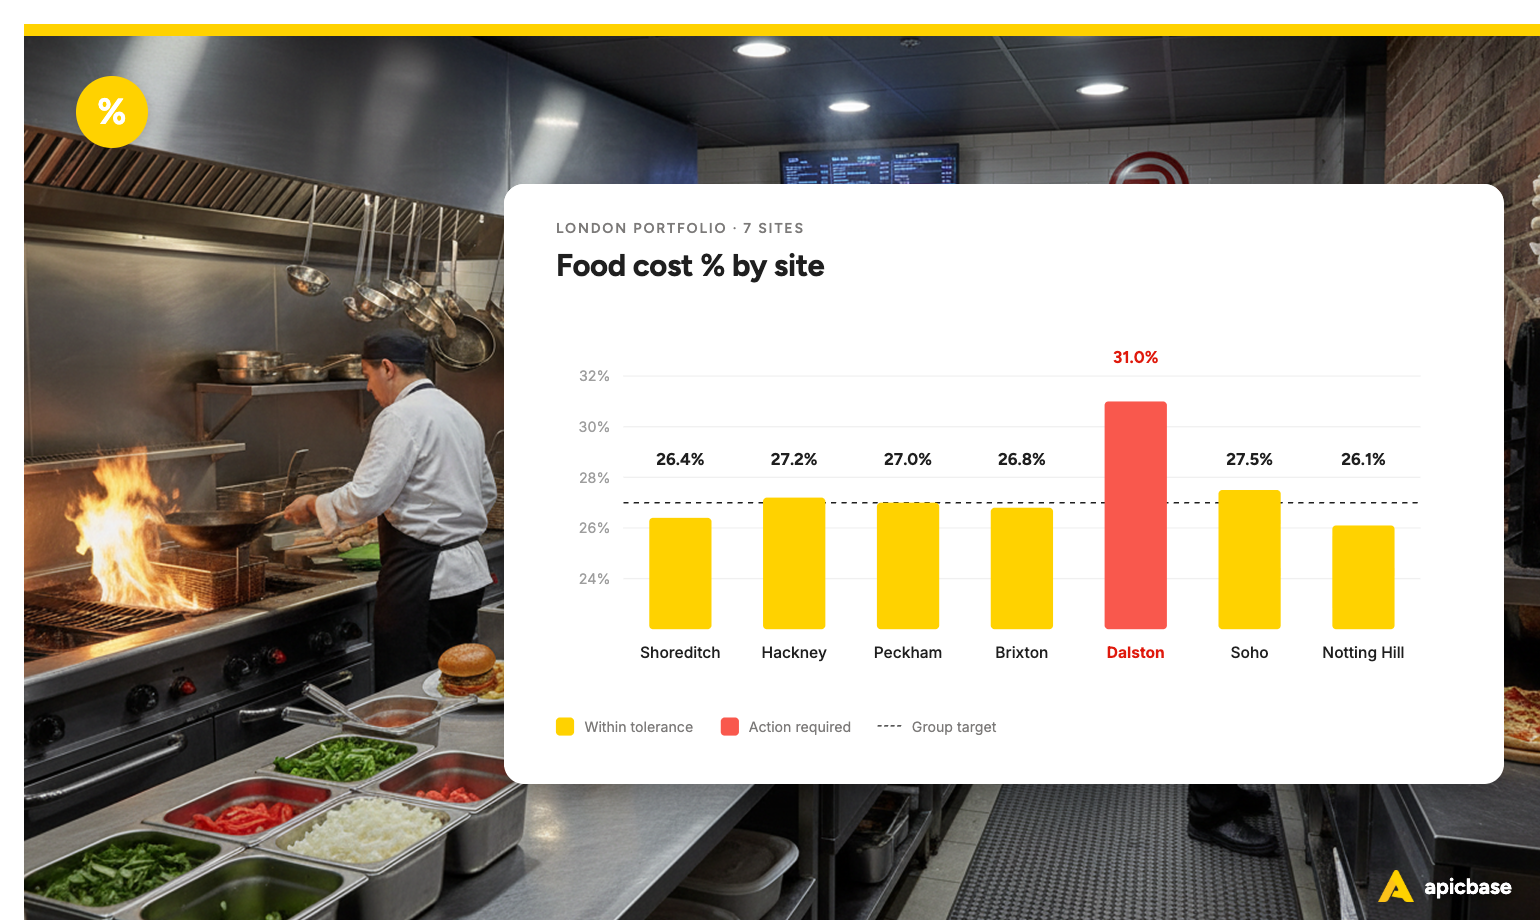
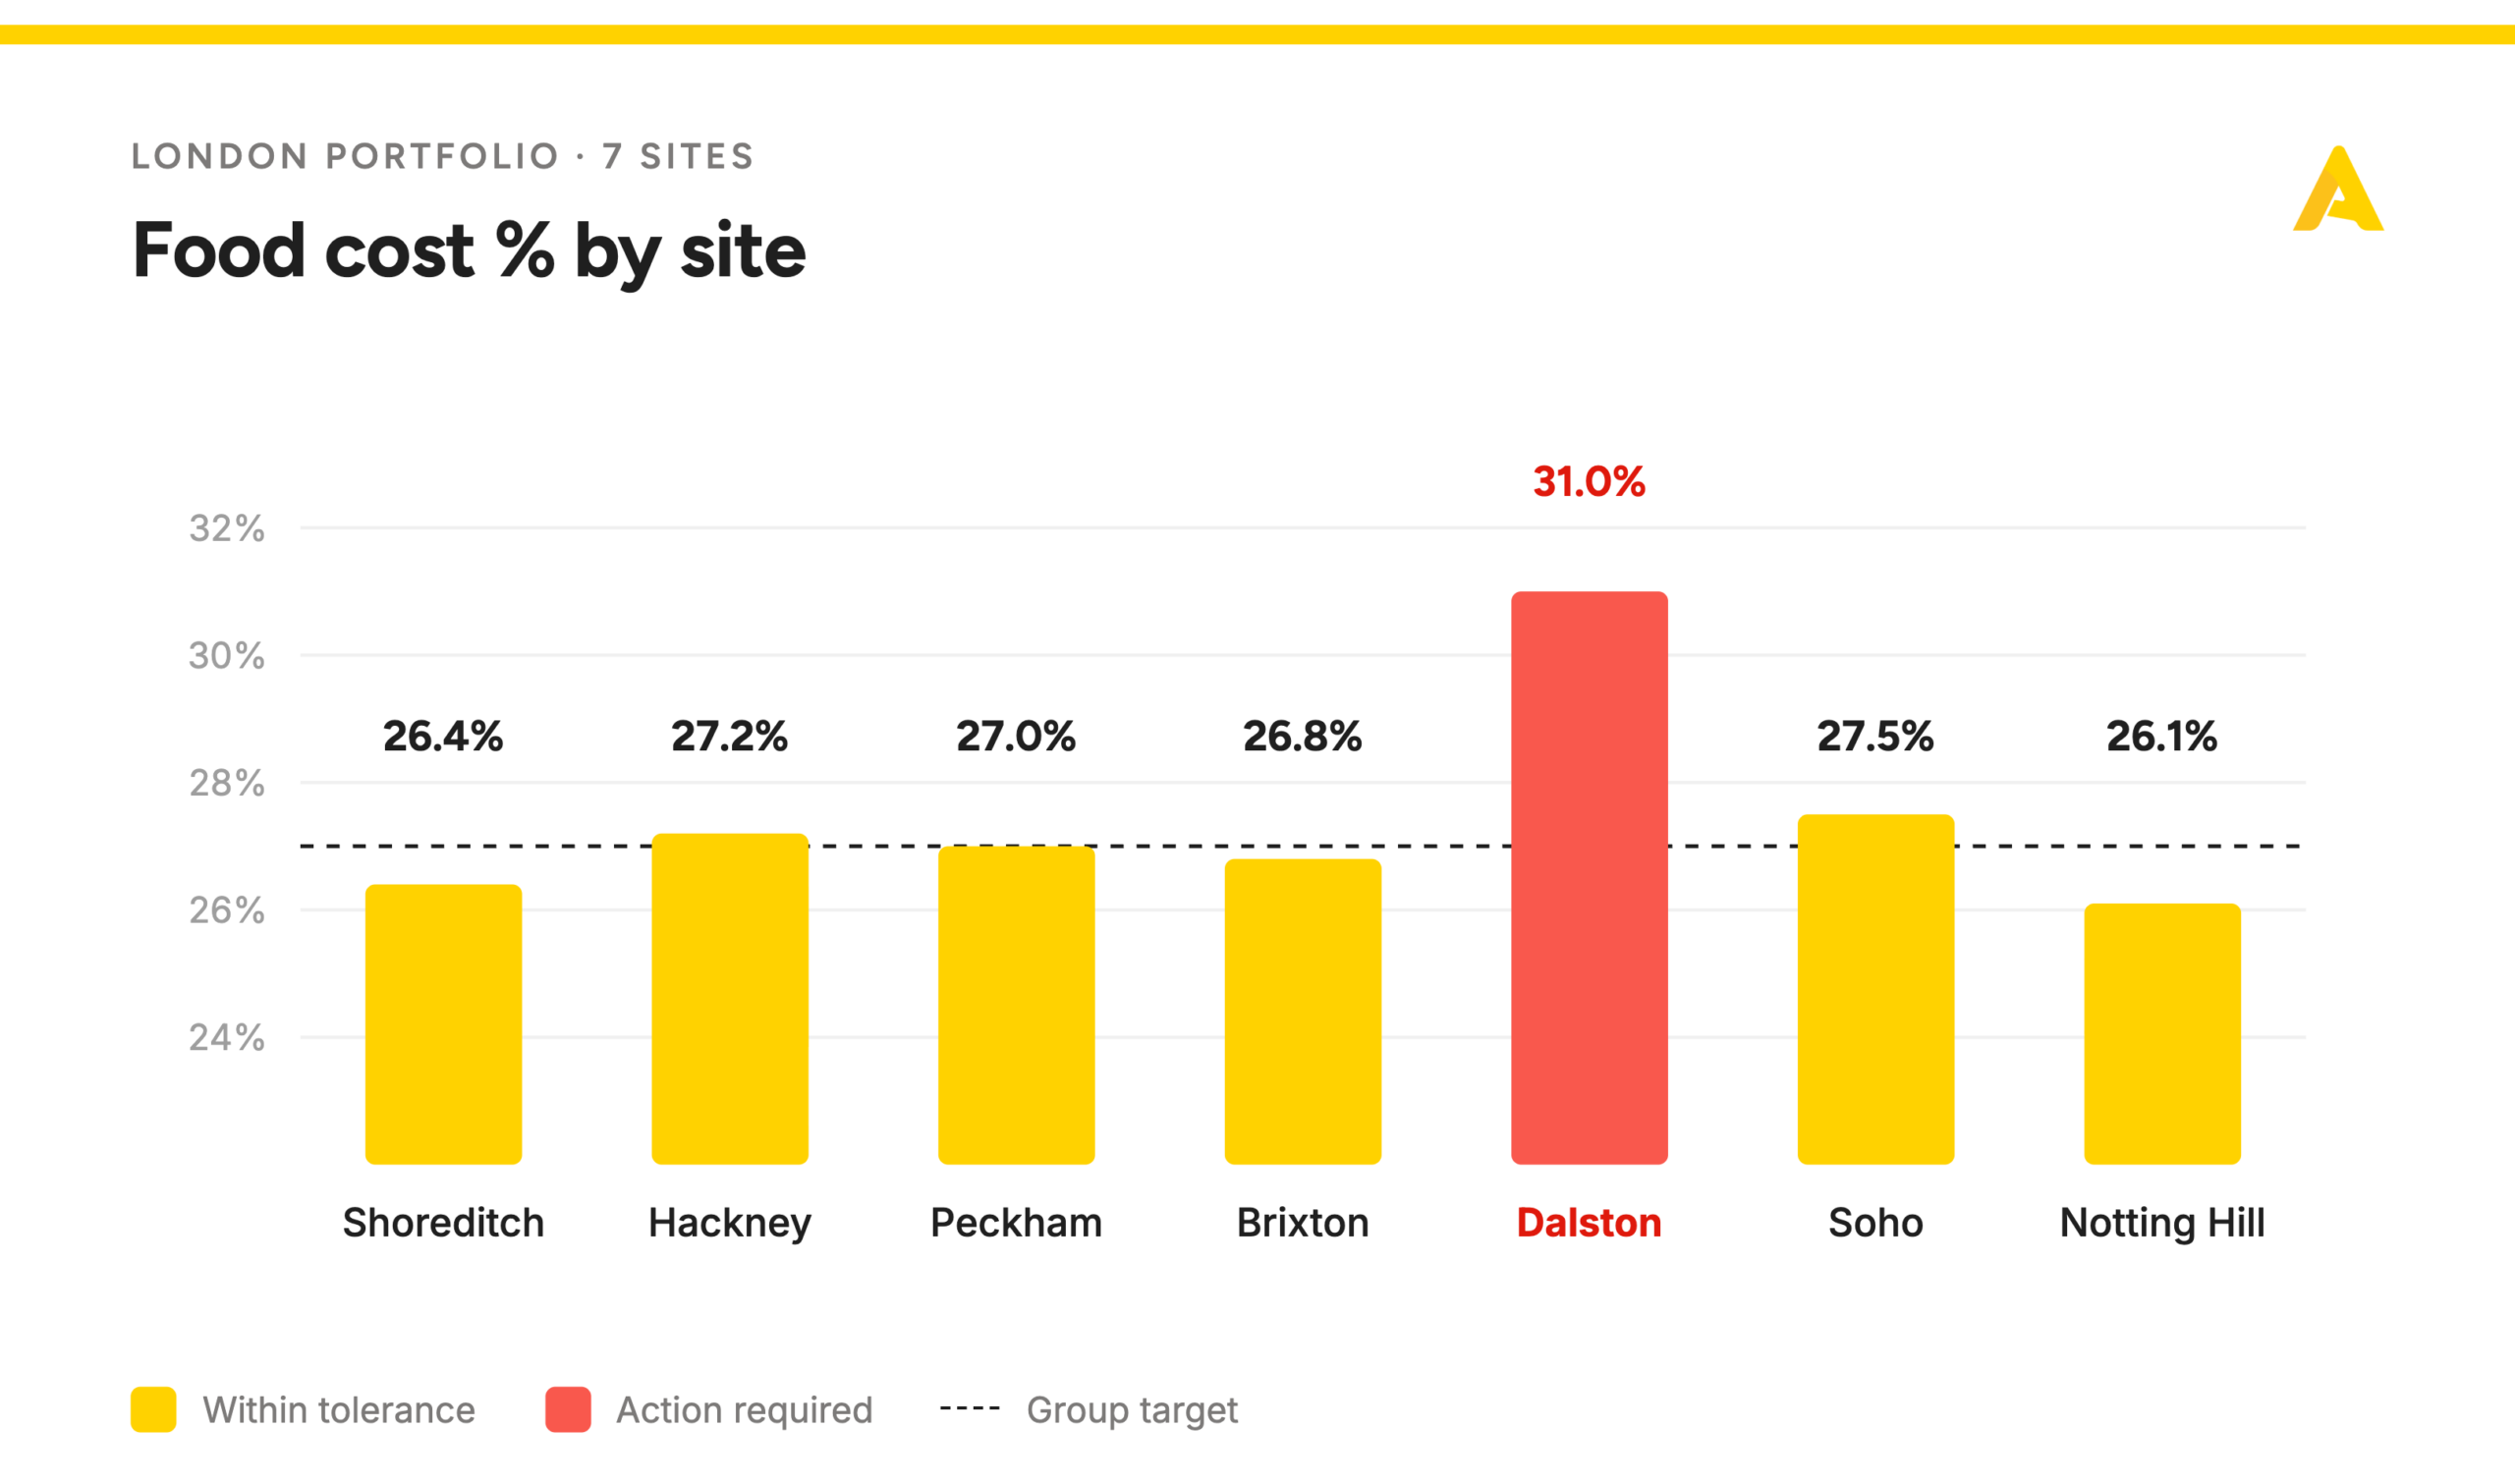
Site-level benchmarking
When you can compare food cost variance across locations — same recipes, same suppliers, same targets — outliers become immediately visible. If 18 of your 20 sites run a 2% variance and two sites run 5%, you know exactly where to focus.
Rieks Renz, development Manager Food & Drink of a hotel chain, described the challenge: “We’re currently at 36% food and beverage cost ratio, while our budget is set at 31%. Understanding where the costs are and how to control them across 16 hotels is a significant operational challenge.”
The comparison also reveals whether a problem is systemic or site-specific. If variance is high:
- Across all instances of the same ingredient, the issue is probably in recipe costing or supplier pricing.
- At one site, the issue is operational: portions, waste, or process compliance.
Apicbase’s variance dashboards break this down by site, by ingredient, and by period, so you’re not comparing top-line food cost across locations, but drilling into which specific item at which specific site is driving the gap.
The scale of the opportunity is significant. A director at a 220-site franchise group put it bluntly: food is 30% of their P&L, and roughly 1.2% of that spend disappears as unexplained shrinkage. These are missing items, waste that never gets logged, or stock that was bought but never sold. At their scale, closing that 1.2% gap is worth millions, he says.
What makes food cost control stick?
Most cost reduction efforts fail after the first month. The workshop happens, the crackdown on portions begins, suppliers get a call — and for a few weeks, food cost improves. Then attention shifts to something else, old habits return, and the numbers drift back to where they started.
Three things separate temporary improvement from lasting control.
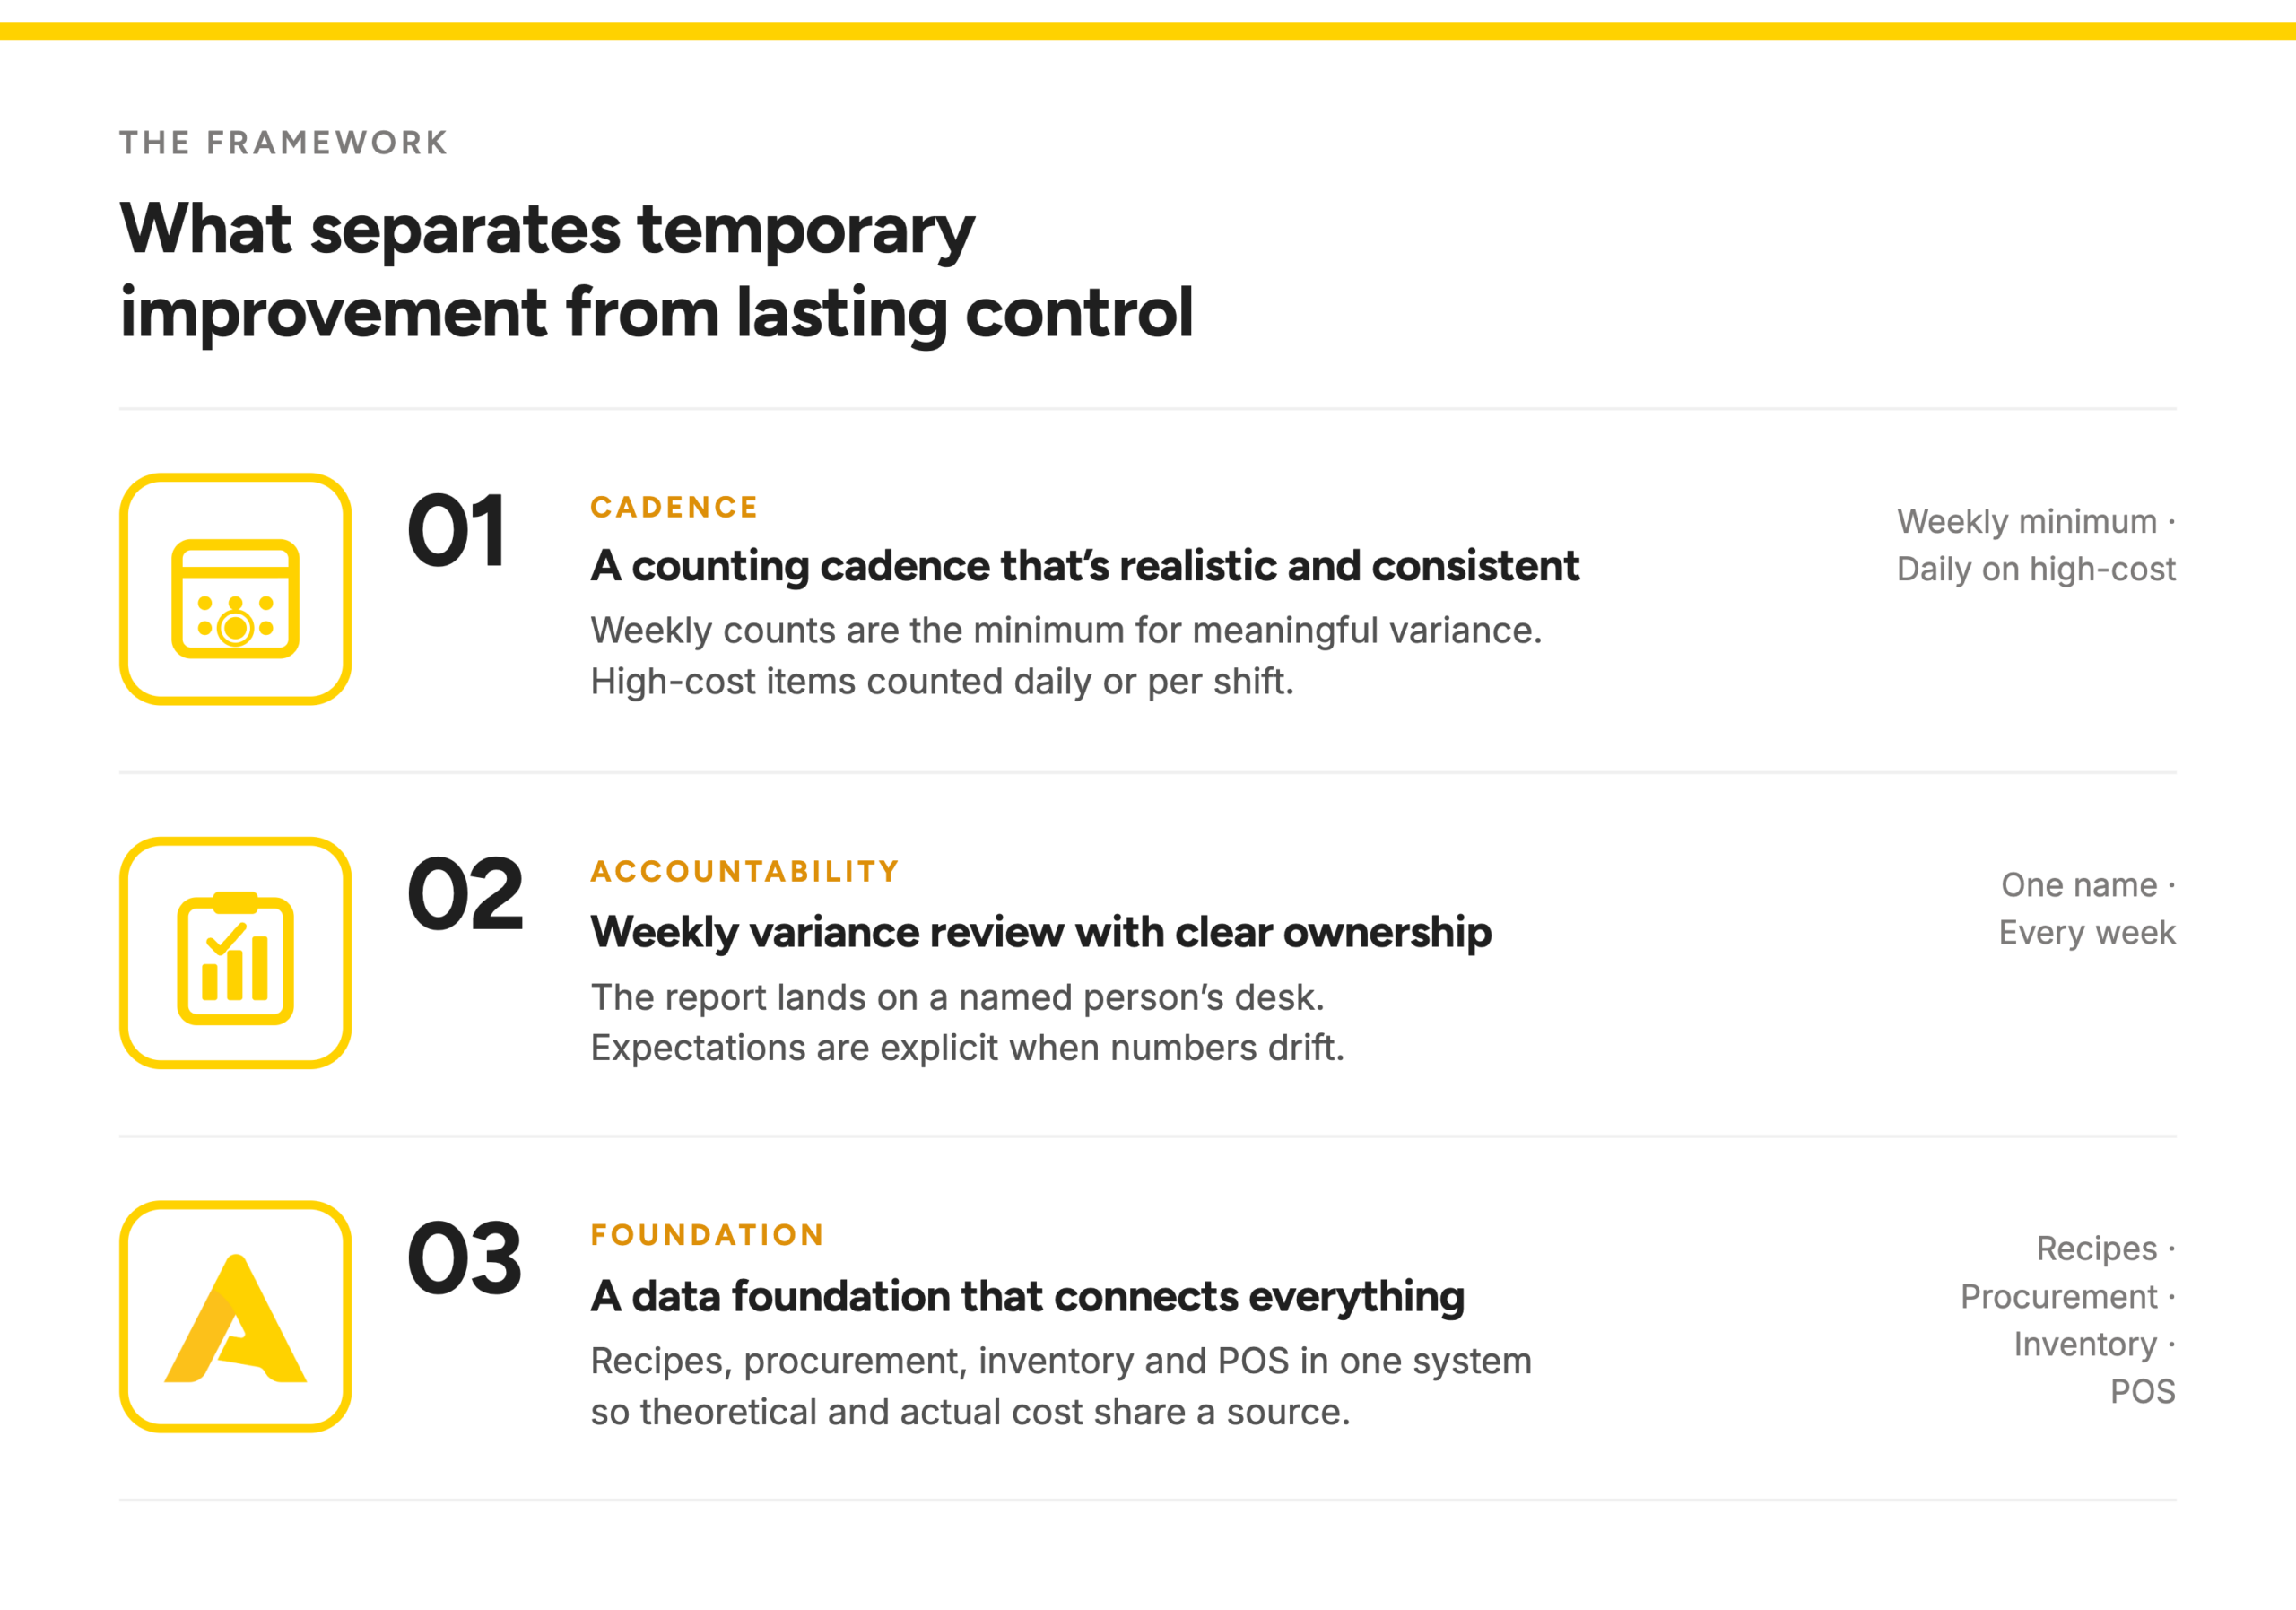
1. A counting cadence that’s realistic and consistent
Weekly stock counts are the minimum for meaningful variance data. Monthly-only reviews reveal problems too late — by the time you see a variance that’s been building for four weeks, the money is already gone. High-cost items need daily or per-shift counts. It’s not glamorous work, but it’s the data foundation on which everything else depends. Without reliable counts, your actual food cost is a guess.
2. Weekly variance review with clear ownership
Someone has to look at the numbers, and someone has to be responsible for acting on them. The variance report should land on a specific person’s desk every week — the site manager, the F&B director, the operations lead — with clear expectations about what happens when numbers drift.
Apicbase generates these reports automatically. Site-level variance lands in the right inbox at the cadence you set, so the review habit doesn’t depend on someone remembering to pull the data.
Ellen Snel, Data Analyst at RCE, described the shift: “We can now see at detail level where variance sits, and address it directly.” Visibility without accountability changes nothing.
3. A data foundation that connects everything
If recipes live in one system, procurement in another, inventory on a clipboard, and sales in the POS, you can’t close the loop. You can’t calculate meaningful variance. You can’t trace a cost problem to its root cause.
Peter Schimpl at L’Osteria named the frustration: “The biggest challenge is getting inventory management right. You think you have theoretical cost from recipes, you have theoretical usage from the POS, but you don’t really know where the difference between theory and practice comes from.”
Connected data solves this by unifying ingredient, recipe, and supplier information. Apicbase’s food cost control platform integrates these data streams into a single system, so variances are calculated automatically rather than assembled manually from disconnected sources.
How do you track food cost reduction over time?
Reducing food cost is a result. Tracking whether you’re sustaining that result requires a small set of KPIs to be reviewed at a consistent cadence.
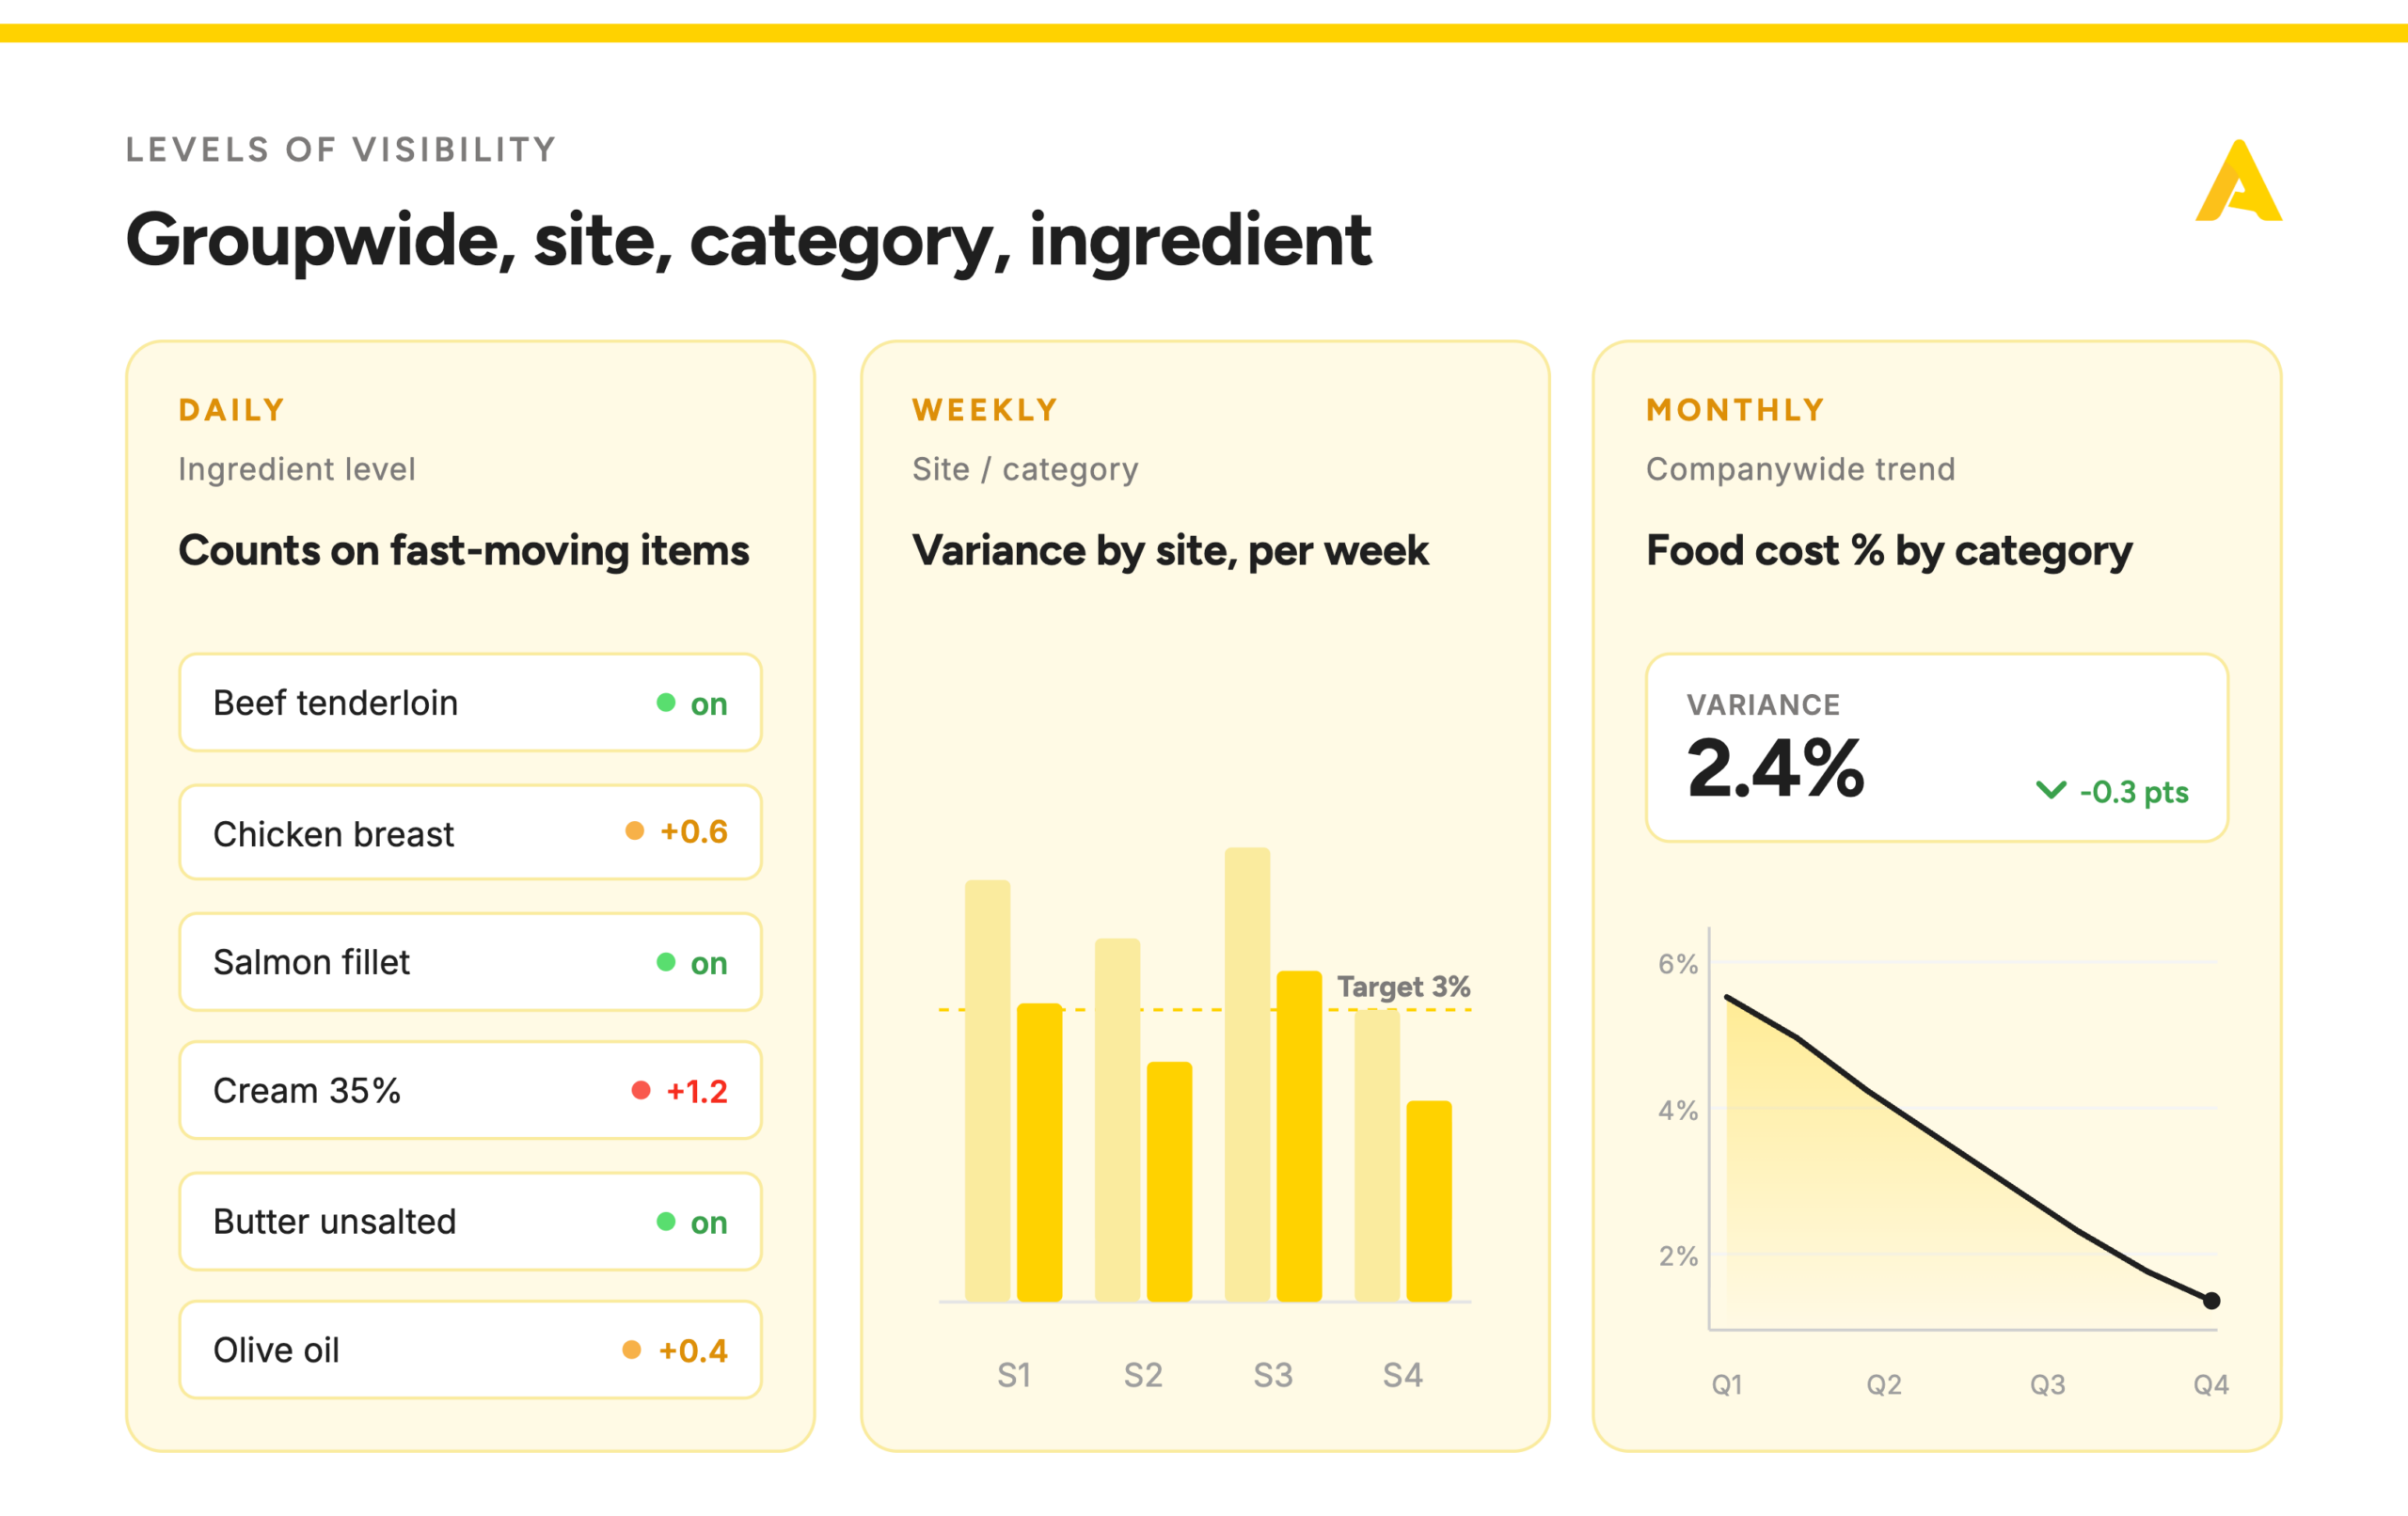
The core metric is food cost variance — the gap between theoretical and actual food cost, expressed as a percentage. Many well-run multi-site operations aim for a variance under 3%. The trend matters more than the absolute number: Is variance narrowing over time, or widening?
- Daily: Count high-value, fast-moving items — proteins, dairy. Flag anything that looks off before it compounds.
- Weekly: Run variance reports per site. Compare against the previous week. Identify which ingredients or categories are driving drift.
- Monthly: Review food cost as a percentage of revenue, COGS by category, and variance trends across the group. This is the P&L-level check, but now it’s backed by ingredient-level detail rather than just a top-line number.
Most operators stop at “we know our food cost percentage.” The ones who actually reduce cost go further — they know why the number is what it is and which specific lever to pull next. Analytics dashboards that connect sales, cost, inventory, and variance data make this practical, especially across multiple sites where manual report assembly doesn’t scale.
Kaan Gökmen, co-founder of GK Food Court, described the cumulative effect: “We’ve optimised 6% of our cost of goods since we started.”
Tosca Eggenhuizen at CitizenM reported a similar pattern: “We’ve managed to decrease food costs by about 2% across the chain.” The reductions didn’t come from a single intervention but from sustained visibility and consistent follow-through.
The bottom line
Food cost control doesn’t come down to a single tactic. It’s a system of connected processes.
Prices will keep moving. Suppliers will change. Teams will rotate. That’s how foodservice works. The operators who protect their margins aren’t the ones cutting hardest — they’re the ones who’ve built a system that keeps costs in check.
When recipes are standardised, procurement is disciplined, inventory is accurate, and variance is reviewed consistently, food cost stops being a number you explain after the fact. You manage it day to day, across every site.
That’s the difference between reacting to cost and actually controlling it.

See how Apicbase connects recipes, procurement, inventory, and variance in one system, and gives you control over food cost at every site.