

Restaurant sales are growing in almost every market in 2026, but the growth is driven by price rather than volume, and it is unevenly distributed. Margins recovered for some operators while record numbers of others closed.
This guide pulls together the restaurant industry statistics for 2026 across the US, Europe, the UK, and Belgium and explains what they mean for operators.
We have drawn on government data (USDA, BLS, Eurostat, Statbel), industry associations (National Restaurant Association, UKHospitality, HOTREC), neutral research houses (Euromonitor, CGA, Lumina), and peer-reviewed studies. Where our own platform data adds something that public reports cannot, we have included it and clearly labelled it.
The three shifts that define 2026
- Growth is price-led, not volume-led. Value sales are up, but transactions are flat or falling. In Belgium, out-of-home spending grew by just €163 million in 2025, far short of the ~€1 billion needed to keep pace with 4.4% inflation. The market is more fragile than headline growth suggests. (Foodservice Alliance, 2026)
- The cost problem moved from pricing to inputs. Operators have largely exhausted price rises. The advantage now lies in controlling food, labour, and supplier costs, not in charging more.
- Measurement separates winners from the rest. With record closures alongside recovering margins, the operators pulling ahead are the ones who track their costs precisely. It is the clearest pattern in our own data.
Restaurant benchmarks at a glance
| Benchmark | Typical figure | Source |
|---|---|---|
| Food cost (% of revenue, full-service) | 28–35% | National Restaurant Association, 2025 |
| Food cost (% of revenue, full-service) by Apicbase users | ~25% (3 percentage points below the industry range) | Apicbase platform data, 2026 |
| Labour cost (% of sales, full-service median) | 36.5% | National Restaurant Association, 2025 |
| Prime cost (food + labour) | ~60–65% | Industry benchmark |
| Net profit margin (median pre-tax, full-service) | 2.8% | NRA Operations Data Abstract, 2025 |
| Net profit margin (Belgian restaurants, avg) | ~1.7% | Guidea / Statbel, 2023 |
How big is the restaurant industry in 2026?
Foodservice is a multi-trillion-dollar industry that continues to expand, but the rate of expansion has slowed, and growth is increasingly nominal. The picture differs sharply by region, which is why a single number rarely tells the story.
- Global: the foodservice market reached $3.36 trillion in 2025, up 4% year on year, with Asia Pacific making up 40% of sales. (Euromonitor International, 2026)
- United States: restaurant sales are projected to reach $1.55 trillion in 2026, representing real growth of 1.3%. (National Restaurant Association, 2026)
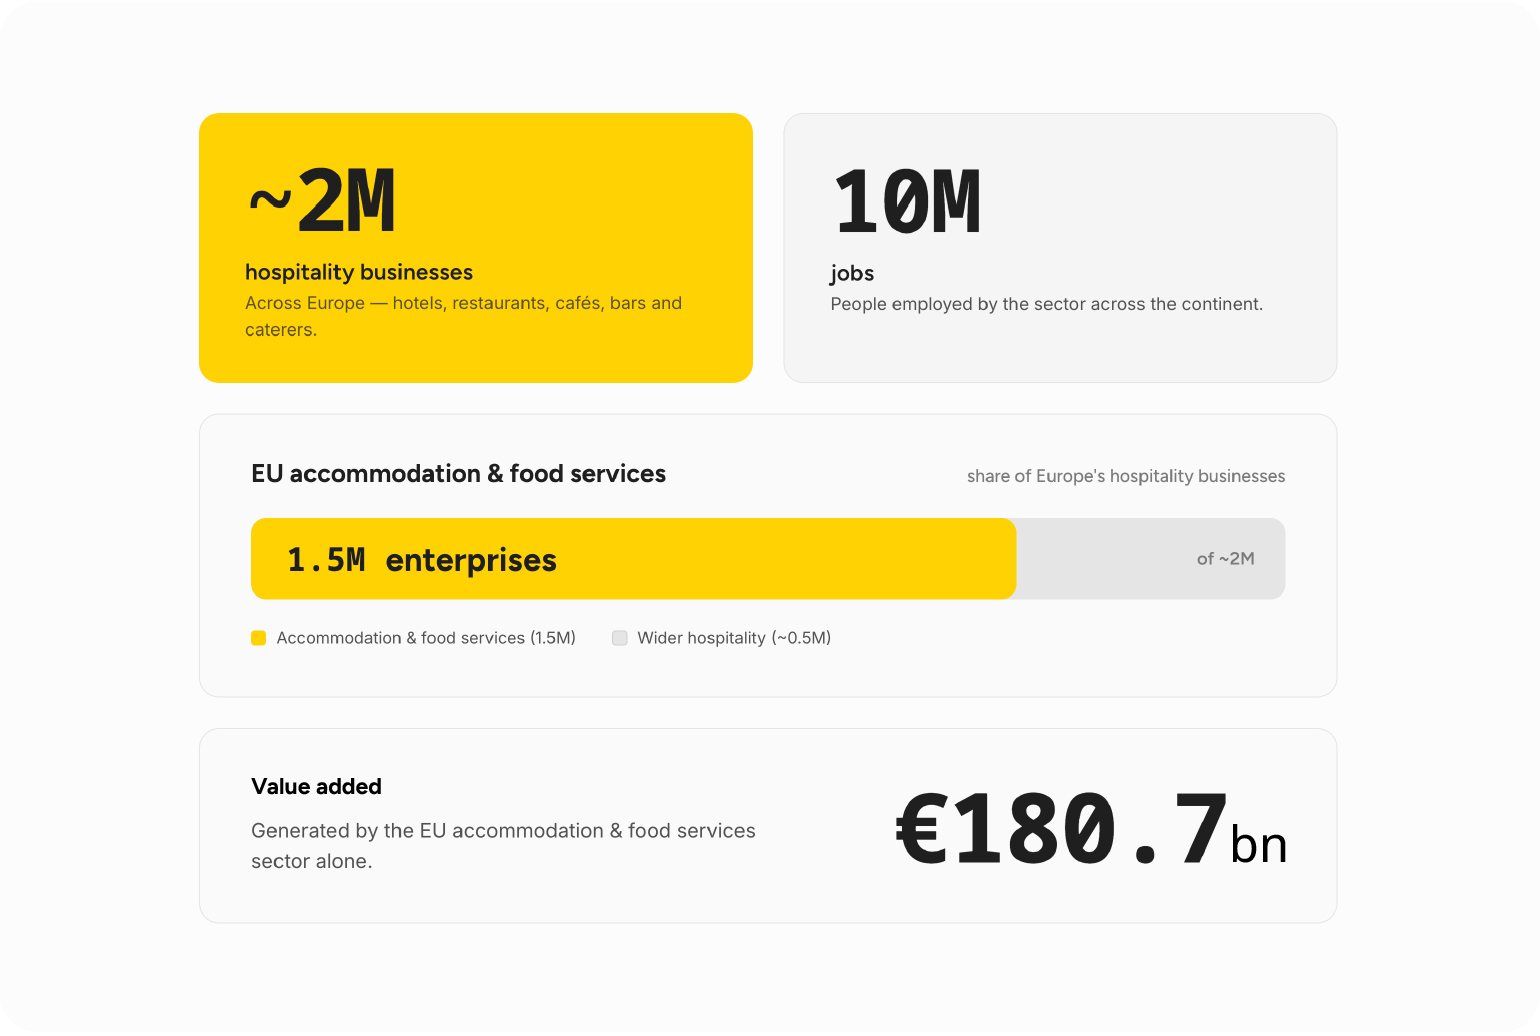
- Europe: about 2 million hospitality businesses and 10 million jobs; the EU accommodation and food services sector alone counts 1.5 million enterprises and €180.7 billion in value added. (HOTREC; Eurostat, 2024–2026)
- United Kingdom: hospitality employs ~3.6 million people and contributes ~£96 billion a year, across 176,685 businesses. (UKHospitality; House of Commons Library, 2025–2026)
- Belgium: household hospitality spend reached €3,233 in 2024, up 14.3% on 2018, but fast food (+52.3%) drove most of the rise. (Statbel, 2026)
- Europe (by channel): contract catering is outpacing commercial catering (restaurants, QSR, cafés, bars), helped by recovering office attendance and the continued externalisation of staff meals. (RaboResearch, Foodservice update 1H 2026)
Strip out inflation, and the growth largely disappears. Across Europe, real-terms revenue growth has become hard to find: the UK and France are the only major markets still growing, and even there the pace is now slowing. Operators planning for 2026 – 2027 should assume flat real demand and compete on efficiency, not on a rising tide.
The cost squeeze: restaurant food and labour costs in 2026
Costs, not demand, are the defining pressure of 2026. The notable change from previous years is the source: tariffs and trade restrictions have made input costs volatile again, just as operators ran out of room to raise prices.
- Rising food costs are the single biggest inventory challenge for 54% of operators, up from 39%; 82% blame tariffs and trade restrictions. (TouchBistro, 2026)
- Food costs run 28–35% of revenue, and labour a median of 36.5% of sales for full-service operators. Together they make up prime cost (food plus labour), the core operating number, at around 60–65% of sales. (National Restaurant Association, 2025)
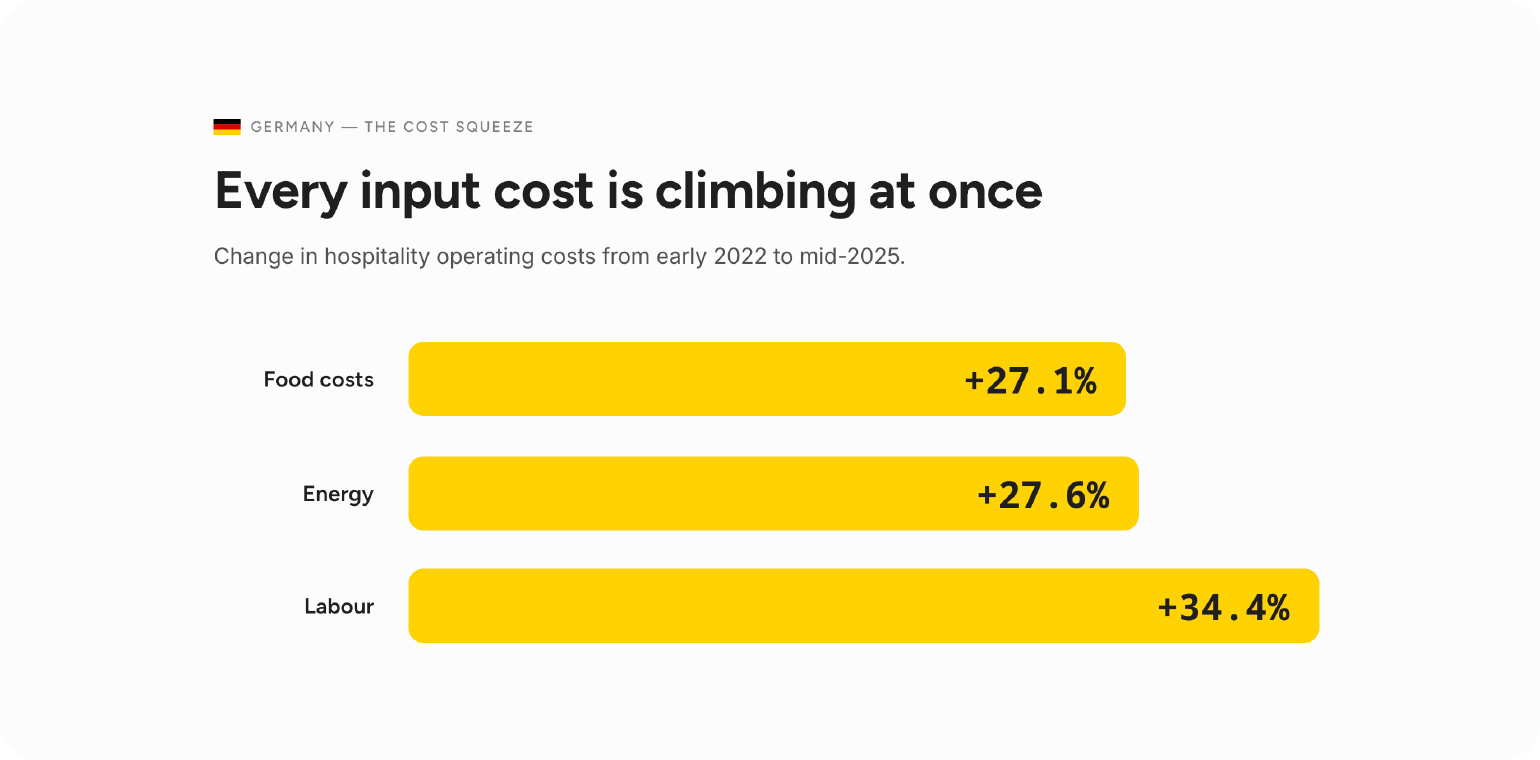
- Germany shows the scale of the squeeze: between early 2022 and mid-2025, hospitality food costs rose by 27.1%, energy by 27.6%, and labour by 34.4%. (DEHOGA, 2026)
- US food-away-from-home prices rose 4.1% in 2024 and 3.8% in 2025, with 3.9% forecast for 2026, still above the long-run 3.5% average. (USDA, 2026)
The operators best positioned to handle this have shifted from raising prices to controlling inputs. Better inventory management and recipe costing give them the insight to act on: the top cost-cutting steps in 2025 were reducing food waste (42%), finding cheaper suppliers (39%), and using technology or AI tools (29%). (TouchBistro, 2026)
Our data show that operators are tightening their grip on costs. You can see it in the intensity of their use of Apicbase.
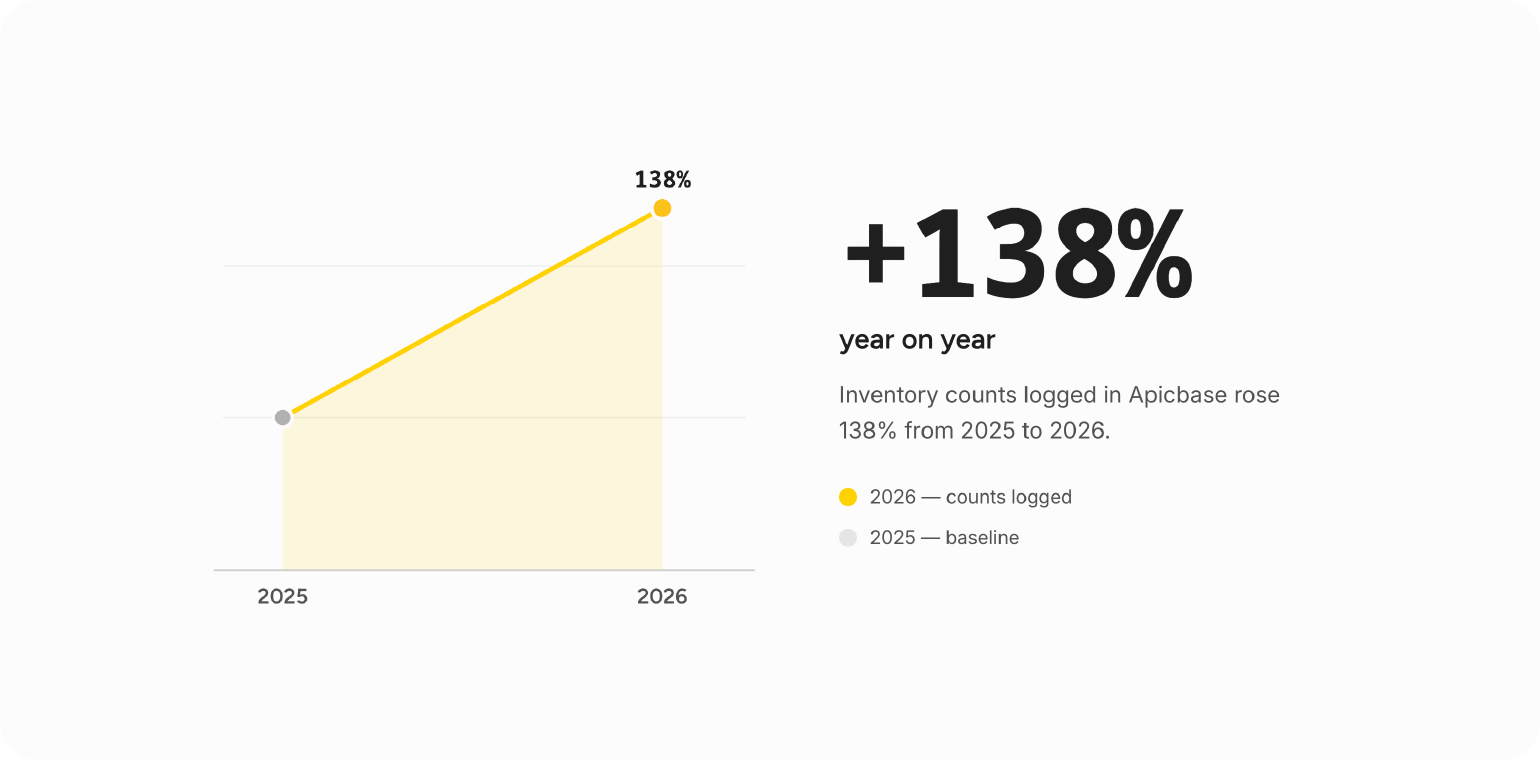
Two things stand out. Inventory counts logged in Apicbase rose 138% year on year. And more operators are connecting their suppliers directly to the platform, so recipe costings update automatically, giving them a direct view on profitability (Apicbase platform data, June 2026).
Restaurant closures and resilience in 2026
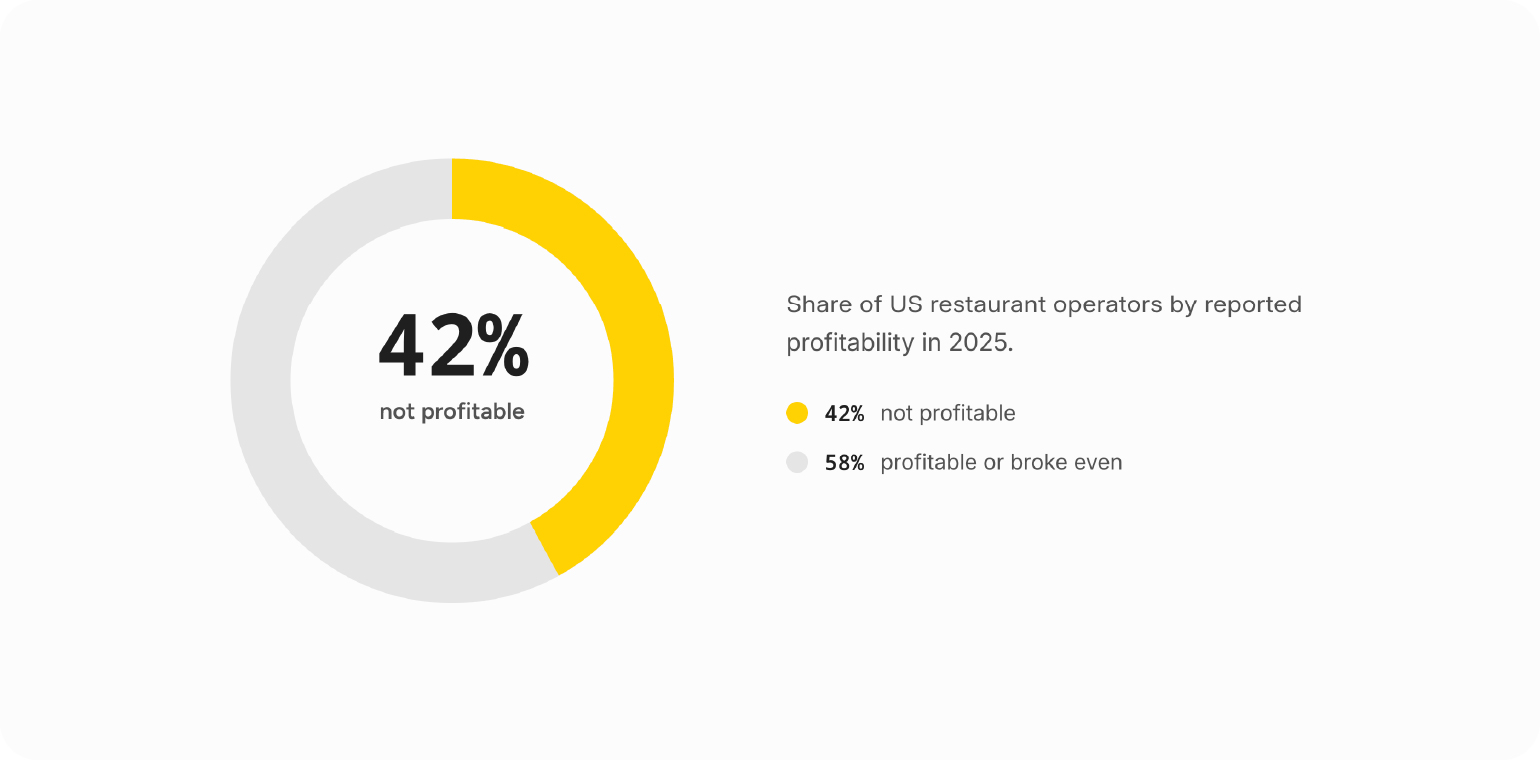
The headline that growth continued masks a hard truth: closures hit records in several markets in 2025. The industry is splitting between operators who have adapted and those who could not absorb the cost increases.
- 42% of US operators say they were not profitable in 2025. (National Restaurant Association, 2026)
- The UK lost premises steadily: about 98,609 licensed outlets remained in March 2026 (14.2% fewer than in 2020), and 3,353 hospitality businesses became insolvent in 2025. (CGA by NIQ; UK Insolvency Service, 2026)
- In Belgium, 1,997 hospitality businesses went bankrupt in 2025, costing 5,631 jobs, a 32.7% rise, concentrated among larger employers, with Brussels up 18.6%. (Statbel, 2026)
- Belgian restaurants operate with an average net margin of just 1.7%, compared with 7.3% across all sectors, leaving almost no buffer for a bad month. (Guidea / Statbel, 2023)
The insight: Revenue, rent, and tariffs are largely beyond an operator’s control. Cost control is not, and operators are taking it, because on net margins of 2–3%, a few percentage points in food cost make the difference between a healthy margin and barely breaking even.
Our data shows this clearly. Operators increasingly use Apicbase to get their food costs under control, and it works. Apicbase users keep food costs at 25% on average across all service models, at least 3 points below the industry benchmark of 28–35% (Apicbase platform data, June 2026).
Menu pricing and the cautious consumer
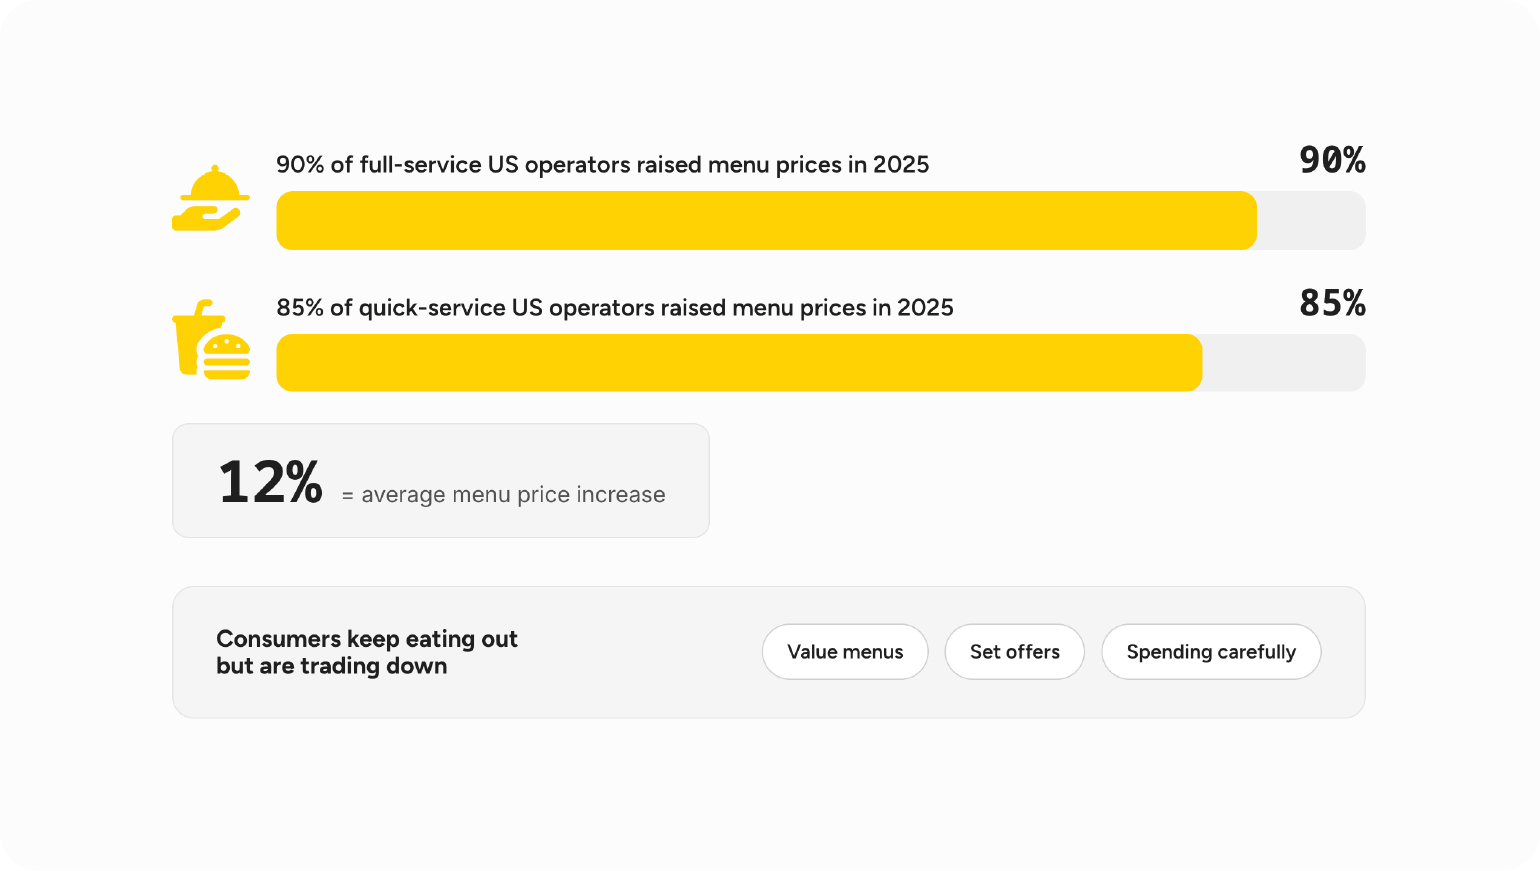
Operators raised prices again in 2025, but they are reaching the ceiling of what diners will accept. Consumers are still eating out, but trading down and spending carefully.
- 90% of full-service and 85% of quick-service US operators raised menu prices in 2025. (National Restaurant Association, 2026) A vendor survey put it lower, at 68% (up from 47%), by an average of 12 percentage points. (TouchBistro, 2026)
- Consumers are responding by trading down, choosing value menus and set offers, even as they keep eating out. (Euromonitor, 2026)
- In Belgium, the clearest sign of the ceiling is that out-of-home spending grew by only €163 million in 2025, well below the ~€1 billion needed to keep pace with 4.4% inflation. Real volume fell. (Foodservice Alliance, 2026)
- Across the Euro area, Germany, Spain, France, Italy, the Netherlands and the UK, restaurant and QSR prices have kept rising faster than both grocery food prices and general inflation, which is pushing more diners toward eating at home and toward grocers’ ready-to-eat ranges. (RaboResearch, Foodservice update 1H 2026)
Further blanket price rises are no longer a safe lever. Strategic menu engineering, raising prices on high-margin items while protecting value favourites, is replacing across-the-board increases.
Restaurant delivery and off-premise trends
Delivery is now a structural part of the market, and it continues to take share. Off-premise covers takeaway, delivery, and any food ordered for consumption away from the restaurant.
- Delivery accounted for 22% of global foodservice spending in 2025, up from 9% in 2019, and is forecast to surpass $1 trillion by 2029, about one dollar in five. (Euromonitor International, 2026)
- Off-premise accounts for a larger share of sales than in 2019 for 58% of limited-service and 41% of full-service US operators. (National Restaurant Association, 2025)
- 81% of operators saw takeout and delivery rise, and adding online ordering lifted overall sales volume by an average of 18%. (TouchBistro, 2026)
The insight: delivery growth is real but margin-dilutive. The operators winning it treat off-premise as their own channel, with separate menus, packaging, and kitchen workflows, rather than bolting it onto dine-in.
Restaurant technology and AI trends
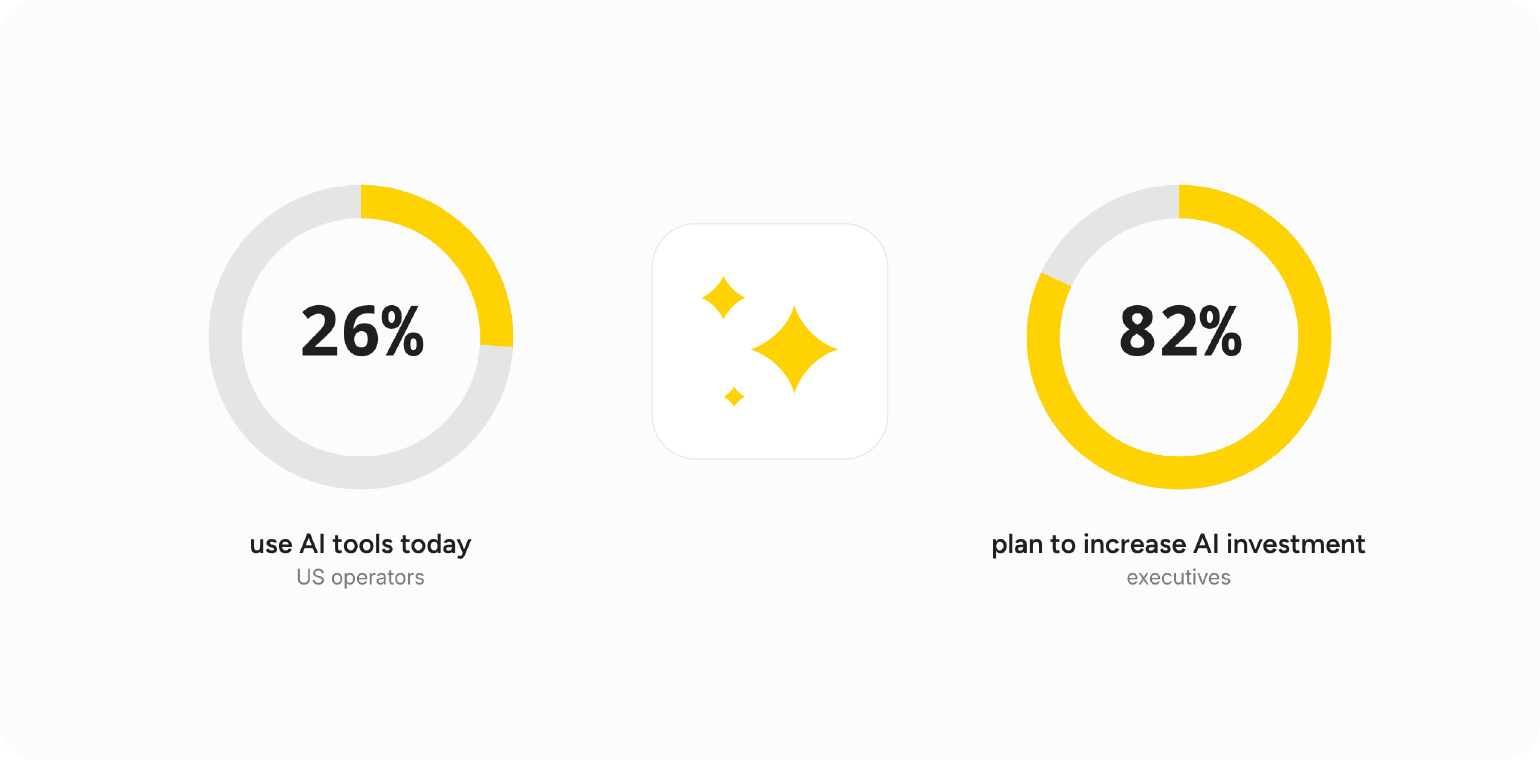
Technology spending is rising, but the mood has shifted from adding tools to consolidating them. The most interesting movement is AI entering the back office.
- POS systems are near-universal (99%), and 97% of multi-location operators now run the same POS across all venues, up from 86%, a clear move toward consistency and integration. (TouchBistro, 2026)
- 26% of US operators use AI tools today; among executives, 82% plan to increase AI investment, with inventory management as one of the most common use cases. (National Restaurant Association, 2026; Deloitte, 2025)
- Peer-reviewed research finds that back-of-house digital transformation measurably raises restaurant productivity, providing academic backing for what operators report anecdotally. (International Journal of Hospitality Management, 2024)
The winning pattern is integrated systems with AI working behind the scenes on inventory, forecasting, and costing, not customer-facing gimmicks.
It comes back to the underlying data: McKinsey finds that around 80% of companies cite data limitations as the main barrier to scaling AI, with most still running on siloed spreadsheets and legacy systems, while those that do scale have clean, integrated, well-governed data.
For multi-site foodservice operators, that means a best-of-breed stack connected by a single data foundation, not a wall of disconnected tools. (McKinsey, 2025)
Restaurant food waste and sustainability statistics
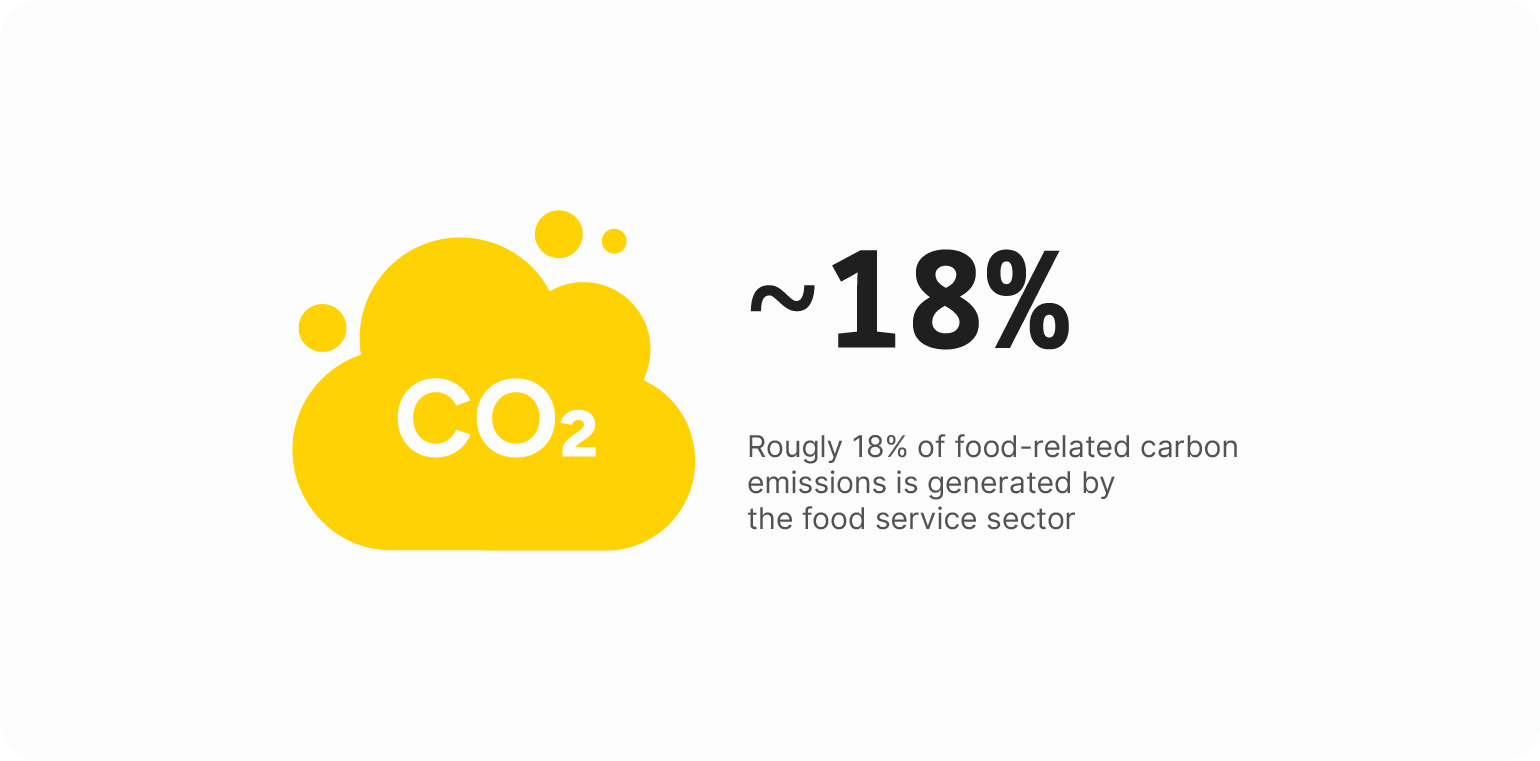
Waste reduction has moved from a sustainability talking point to a core margin strategy, and the business case is now well-evidenced.
- UK hospitality and food service generates about 920,000 tonnes of food waste a year, costing the sector £3.2 billion, roughly £10,000 per outlet. (WRAP, 2025)
- For every $1 invested in cutting kitchen food waste, the average restaurant saved $7, with waste down 26% in a year. (Champions 12.3 / WRI, 2019)
- Food loss and waste account for an estimated 8–10% of global greenhouse-gas emissions; the food service sector is responsible for roughly 18% of the food-related carbon footprint. (UNEP, 2024; MDPI scoping review, 2024)
What Apicbase data shows: Tracking is the first step, and operators are taking it seriously: food-waste entries logged in Apicbase rose 128% year on year (Apicbase platform data, June 2026).

You cannot reduce what you do not measure. The operators logging more waste are the ones acting on it, and at $7 saved per $1 invested, that tracking is one of the cheapest margin gains available.
For larger operators, measuring carbon is becoming a reporting obligation. The EU’s Corporate Sustainability Reporting Directive (CSRD) requires big companies to report their Scope 3 emissions, the value-chain emissions that, in foodservice, are dominated by the ingredients they buy.
What Apicbase data shows. The customers calculating carbon footprints in Apicbase are concentrated at the enterprise end, large contract caterers and multi-site foodservice groups, because they are the ones inside CSRD’s scope. Reporting Scope 3 means costing carbon at the ingredient and recipe levels, so these operators are adopting Apicbase or upgrading to do so.
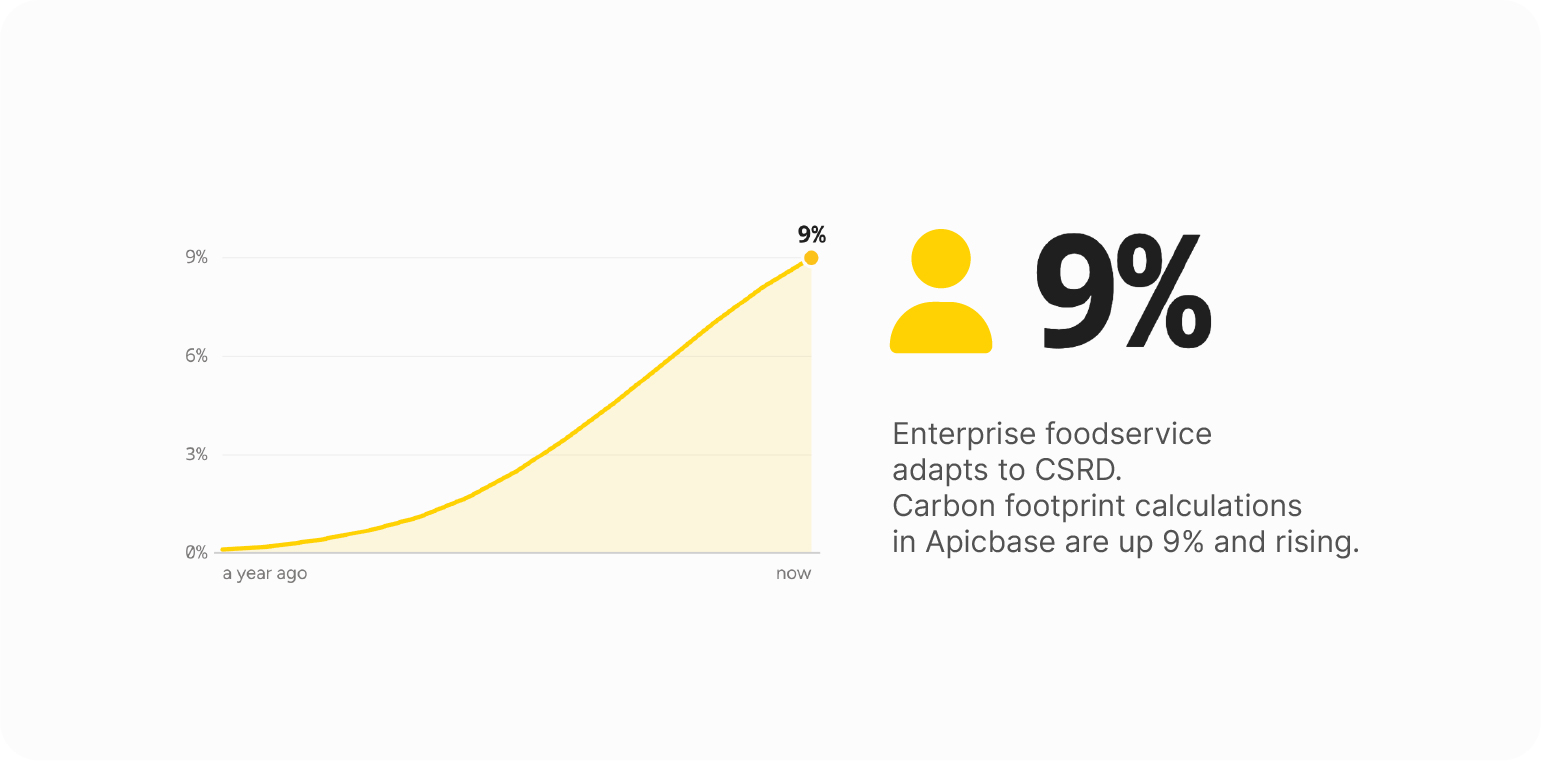
Around 9% of Apicbase users now calculate the carbon footprint of recipes, up from almost none a year ago (Apicbase platform data, June 2026).
Restaurant labour and workforce statistics
Labour remains the highest and least avoidable cost. The strategy has shifted from cutting staff to making existing teams more productive.
- 96% of operators spent more on labour in 2025; full-service labour runs a median of 36.5% of sales. (TouchBistro; NRA, 2025–2026)
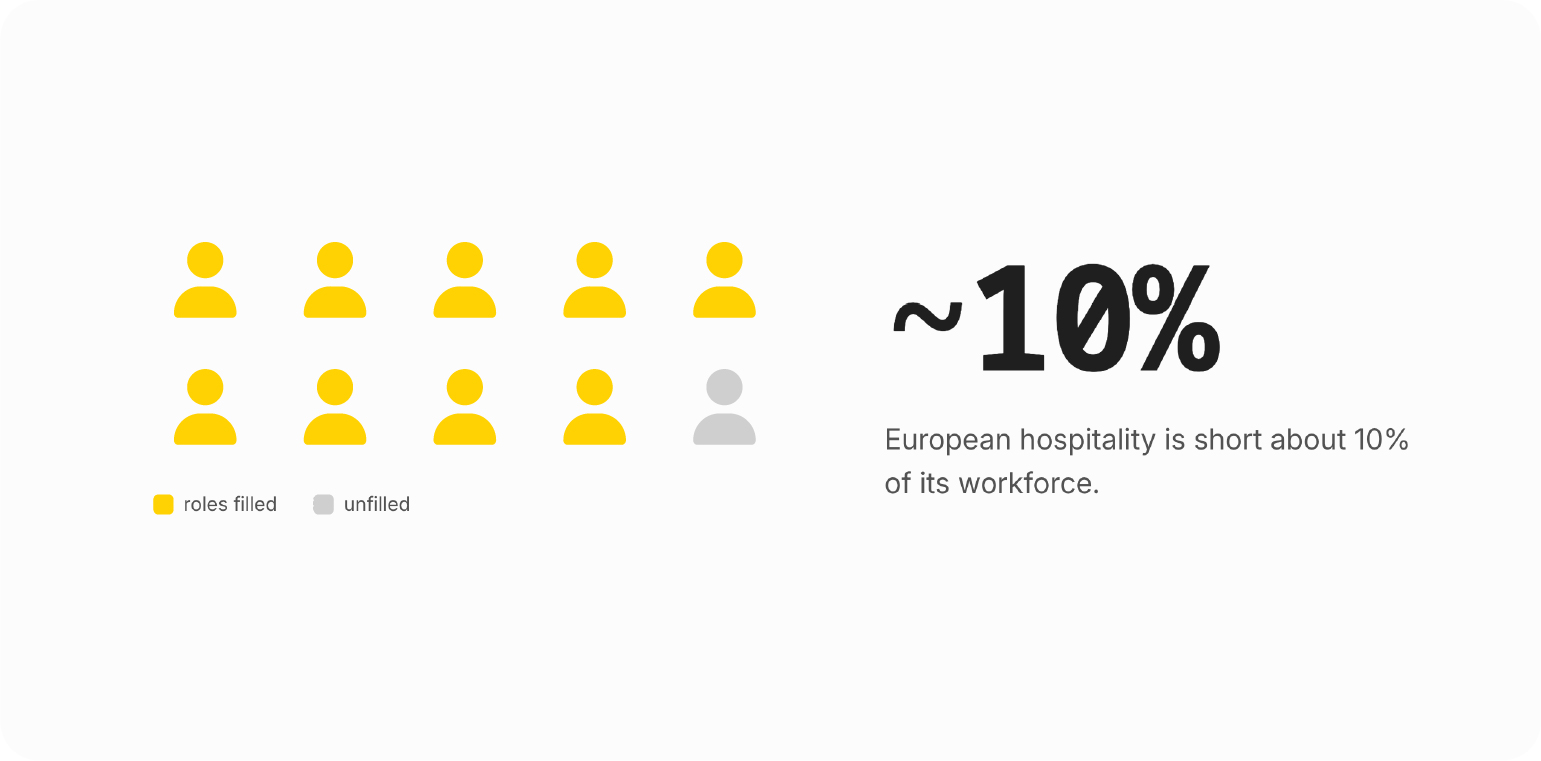
- Turnover remains high; accommodation and food services have one of the highest quit rates of any US sector, and European hospitality is short about 10% of its workforce. (US Bureau of Labor Statistics; HOTREC, 2026)
- The US workforce is young: 40% under 25, 60% under 35, compared with 13% of the overall workforce under 25; employment is projected to reach 15.8 million in 2026. (National Restaurant Association, 2026)
With wages rising and staff scarce, the realistic lever is productivity per labour hour, supported by scheduling, automation, and clear processes, rather than headcount cuts.
What it means for operators in 2026
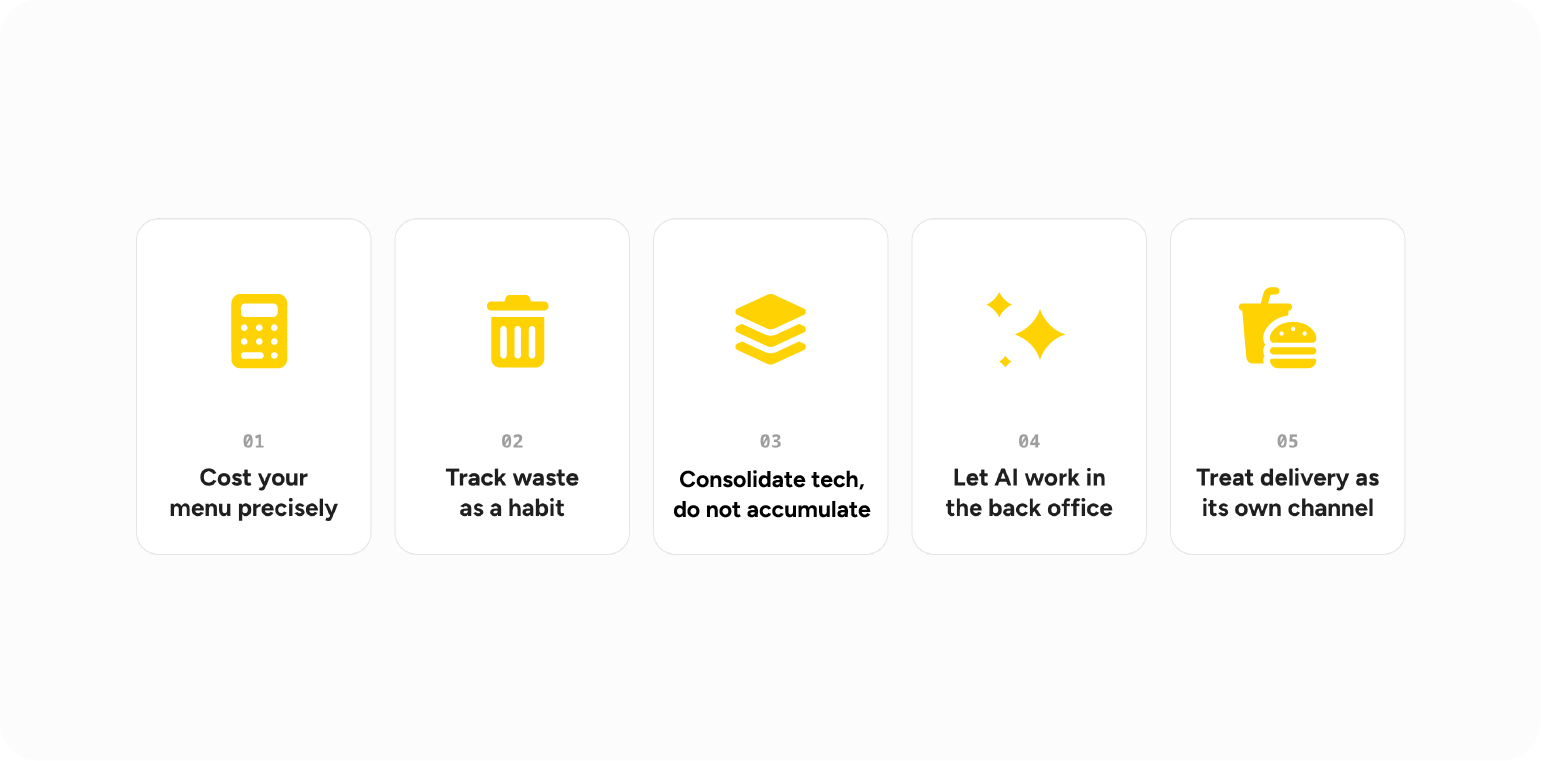
The data points to a clear playbook. Growth will be hard to come by on demand alone, so the advantage lies in operating more tightly than the competition.
- Cost your menu precisely. With food at 28–35% and margins as thin as 1.7% in some markets, knowing the true cost of every dish is the difference between profit and loss. See restaurant menu costing.
- Track waste as a habit, not a project. The evidence ($7 saved per $1) is strong, and it is the cheapest margin available. See how to reduce food waste in multi-site restaurants.
- Consolidate, do not accumulate. Favour integrated systems your whole team can use, such as restaurant inventory management software, over a stack of disconnected tools.
- Let AI work in the back office. Inventory, forecasting, and costing are where AI pays off first.
- Treat delivery as its own channel. Separate menus and workflows, supported by POS integration, protect both margin and the dine-in experience.
The through-line across every market and metric: the operators who measure are the ones taking action, and, on the evidence of our own platform, the ones pulling ahead.
Methodology and sources
This guide draws on government statistics (USDA, US Bureau of Labour Statistics, Eurostat, Statbel), industry associations (National Restaurant Association, UKHospitality, HOTREC, DEHOGA), neutral research houses (Euromonitor, RaboResearch, CGA by NIQ, Lumina Intelligence, WRAP, ReFED, Champions 12.3), peer-reviewed journals, and Apicbase’s own platform data. Figures are dated to their source year. Apicbase platform figures are aggregated as of June 2026.
Frequently asked questions
The global foodservice market reached $3.36 trillion in 2025; US sales are projected at $1.55 trillion for 2026. (Euromonitor; National Restaurant Association)
Both. Value sales are growing, but more than 4,500 UK sites are projected to close by 2026; 3,353 UK businesses became insolvent in 2025; 1,997 Belgian hospitality businesses went bankrupt; and 42% of US operators were unprofitable. (Euromonitor; CGA by NIQ; Statbel; National Restaurant Association)
The median pre-tax income for full-service restaurants is around 2.8%; Belgian restaurants average about 1.7%. Self-reported operating margins run higher.
Restaurant Association). Apicbase users, on average, outperform the industry benchmark across all service models by 3 percentage points with a food cost of ~25%.
A median of about 36.5% of sales for full-service. (National Restaurant Association)
POS systems are near-universal, AI is moving into back-office tasks such as inventory and forecasting, and 74% of operators plan to increase technology spending, with an emphasis on integrated systems. (National Restaurant Association; Deloitte)